Say Goodbye to Amazon Frustrations
Your All-in-One Amazon Growth Partner For Established Brands
We handle PPC management, optimized listings and catalog management, freeing you to focus on growth and profits.
Trusted by 6,000+ Sellers & Brands





Our Case Studies
Cosmetics Brand
Before:

After


The Challenge
A cosmetics brand was struggling with an alarmingly high ACoS and a lack of profitability, which forced them to halt their advertising efforts for an extended period.
After 2 years of no PPC and near-zero revenue, they decided that they needed a breakthrough solution, which is how they found us.
During the period when they still ran ads, they averaged a 45% ACoS on $25,000 in monthly spend, which made them stop PPC until our involvement in December of 2022.
The Solution
- Created 466 campaigns for the top 3 ASINs in the account.
- Utilized all ad types, targeting types, and match types.
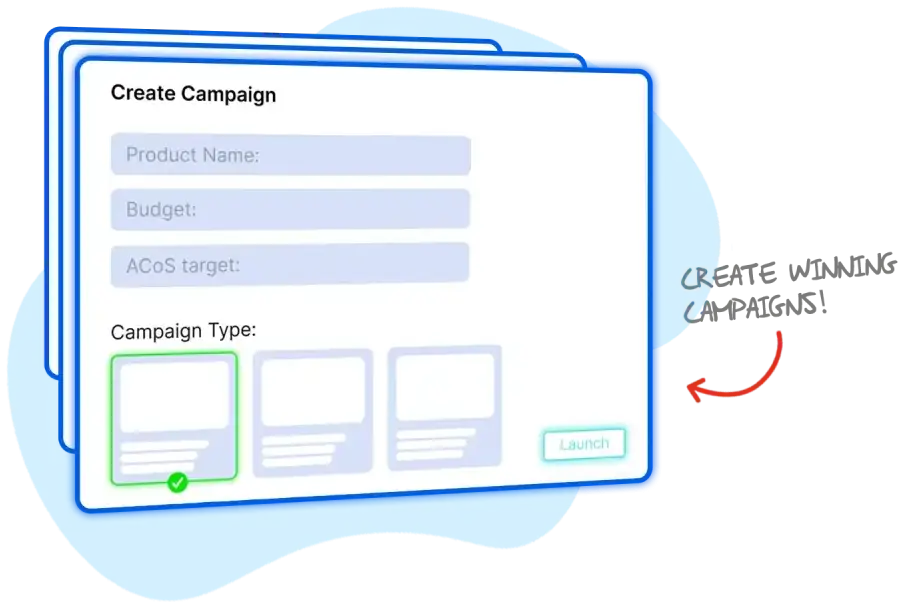
- Switched on automated bidding with a 20% ACoS target so we could control our advertising costs.
- Discovered and added over 700 keywords to our campaigns
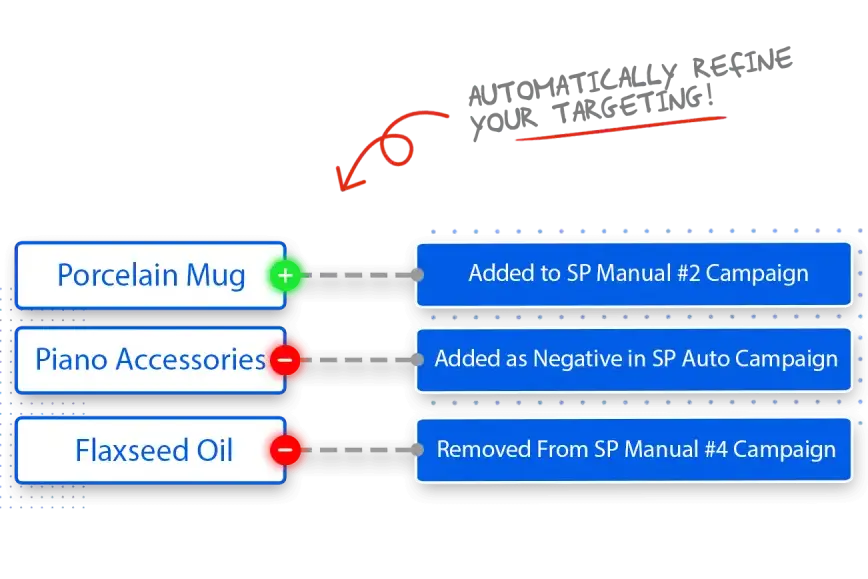
- Used tools to cut down on wasted spend on Broad, Phrase, and Auto campaigns.
The Results
5x
Increased ad sales by 5X within 6 months of our work.
20%
Decreased ACoS Down to 20% within 6 months of our partnership.
$400k
In August 2023, the brand reached $400k in monthly ad sales with a 13% ACoS
Here's What Some of Them Have To Say

Bryce Alderson
Founder of Orphic Nutrition (Sold to SellerX)7-fig Supplement Brand

Bashar Katou
Founder of BJK UniversityAmazon Mentor to 13,000+ Students

Giselle Solano
Operations Manager @ Stratton Home Decor7-fig Home & Decor Brand


Here's how we help
you're not alone
Dedicated Account Manager
Have a dedicated Amazon ads expert guide you on all things strategy & PPC to help you win faster and skip the learning curve. Get advice on campaign set up, advertising tactics and growth to propel your business forward.

Spend More on The Right Keywords
Amazon PPC Management
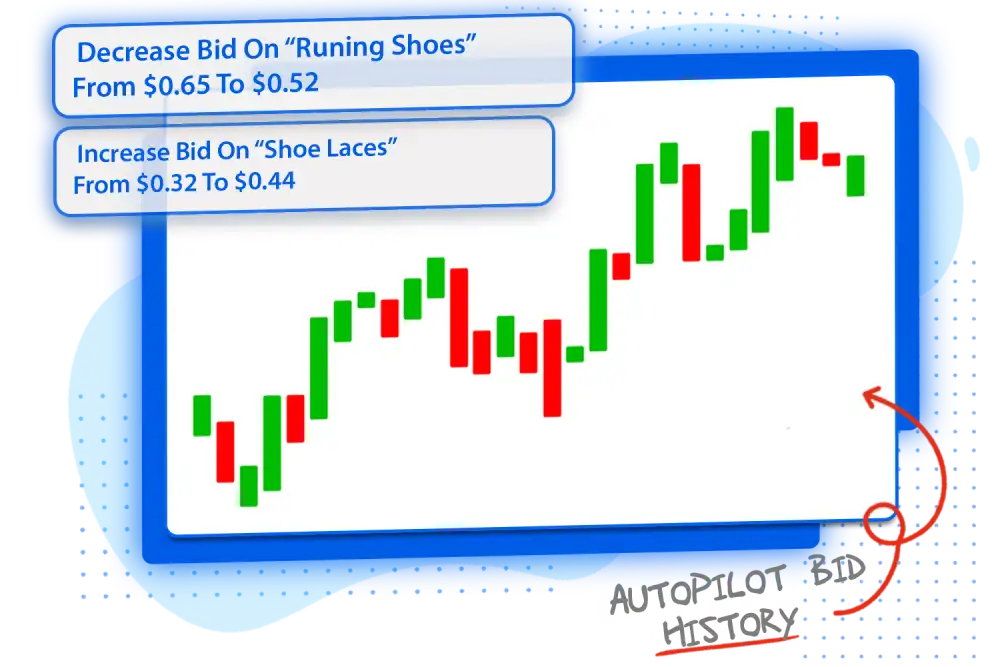
Spend more on your top keywords and less on the keywords losing you money. We will help you divert spending from low performing targets to high performing ones to lower your ACoS and drive more sales.
Work on the business not in the business
Amazon Full Account Management
We're your one-stop shop for brands aiming to grow. If you need help with Amazon, like improving listings, SEO, PPC, planning for seasons, or analyzing data, we've got it all covered, except product research!
no more talking to seller support
Everything Seller Central
Record all your Seller Central issues, tasks, and follow-up needs with our specialists. From submitting cases, finding orders, to updating listings, our experts handle everything using top industry methods.
Why Us?

Eliminate manual work
No headaches with manual campaign management... ever.

Scale your business
Run unlimited campaigns - without breaking the bank or hiring more Account Managers.

Easy to use
No complex onboarding or long tutorials. OJ Digital is powerful, but simple.

Tailor ads around goals
Ramp up sales, cut ad costs or increase category share - it's your call.

1:1 Expert mentorship
Want a PPC specialist on speed dial? You got it!

Actionable reports
Learn why we adjusted some bids. When to restock specific products. Always stay up-to-date.
We've Been Featured On


Our Package
In Need Of Creatives Only?
A to Z Account Management
Only 2 Spots Left
Full account management from A to Z.
Unlimited ASINs
- WHAT'S INCLUDED:
- Dedicated Account manager
- Complete Amazon account management
- Listing improvement recommendations
- Catalog issues resolutions
- Listing optimization
- Competitor research & strategy creation
- Smart order fulfillment
- Friday report
- Easy credit-card payments
- Pause or cancel anytime
- No contract
Have a custom request?
How Our Service Works
Strategy call & discussion on the plan.
Subscribe to the plan that fits your situation.
Give us the permissions & access client portal.
We get to work and update you every Friday.
Have a Question? Look here
No, we don’t do consulting nor product research. Our account management services are reserved for mainly PPC managements, along with support in catalog issues and basic listing optimization.
We’ve been in business since 2016, and working with 7 and 8 figure Amazon businesses. Started out as a listing optimization company, then our clients asked us if we could help them with account management too. That’s when we decided to go full service, and loved seeing our clients’ peace of mind.
It takes anywhere from 7-14 days for you to start noticing positive results. The campaigns become more efficient at optimizing your keywords and placements over time.
All marketplaces are included in all packages. There is no extra charge for adding and managing additional marketplaces.
In addition to Amazon PPC Ads automation, you will also have access to inventory restocking forecasts, automated customer follow up emails for Amazon, automated customer review request, smart fulfillment for your brand websites (shopify/woocommerce) and access to Third Party Warehouses (3PL) in US and Canada
US, Canada, UK, Whole of Europe. Note that except EU, we cannot ship cross country with Amazon Fulfillment.
Haven’t found your answer?
Meet OJ

We’re O (Omar) & J (Jessica),
Here to help you dominate the e-Com Game.
Husband and wife duo, co-founders, and business partners, we bring a unique blend of expertise and passion to the Amazon marketplace. We’re not just Amazon experts; we’re a global force, fluent in 7 languages combined!
Having managed over $400M in Ad spend, and optimized over 20,000 Amazon product listings across 7 international markets, our Triple-Impact Method™ has proven its effectiveness time and again.
Our mission is simple yet ambitious: to help brands crush the Amazon game.
Join forces with us and let’s craft your Amazon success story together!
How about this first?
A quick 1-on-1 strategic call. We'll talk about your current strategy. No matter what happens on the call, we'll share applicable Amazon Ads tactics for you to walk away with.


