Are you an Amazon seller interested in what Amazon Brand Analytics is and how it can help you build your brand?
I’m here to help you.
As a veteran seller, I know the ins and outs of Amazon Brand Analytics and want to share my insights with you.
I wrote this guide to discuss all you need to know about Amazon Brand Analytics. I’ll discuss how Amazon Brand Analytics works, how it can help you, what its benefits are, and more.
Let’s begin.
What Is Amazon Brand Analytics?
Amazon Brand Analytics is a tool from Amazon that registered brand owners can use to increase sales, foster customer loyalty, and ultimately build their brand.
Amazon Brand Analytics provides the following customer demographic information:
- Location
- Income
- Age
- Gender
- Marital status
The tool also provides the following data:
- The keywords or search terms shoppers use to find products
- The products shoppers buy together
- The products shoppers buy regularly
- The products shoppers compare with each other
Amazon Brand Analytics data helps you with target the right customers and improve your products’ visibility with targeted ads.
Understanding this data lets you understand customers’ buying habits. Attracting your target audience with the right marketing strategies is easier when you understand customer behavior.
To sum it up, Amazon Brand Analytics can provide the insights you need to know your customers, the way they search for products, the products they want to buy, and the prices they prefer.
You can use these insights to achieve the following (among other things):
- Craft more engaging and personalized marketing strategies.
- Set more attractive pricing.
- Offer more enticing product mixes.
Who Can Use Amazon Brand Analytics?
If you open your Seller Central accounts and don’t see the Brand Analytics tool, does it mean you can’t use it?
Who determines access to the Brand Analytics tool?
You must be an Amazon Brand registered seller to access Amazon Brand Analytics. You cannot access this feature unless you own the brand on Amazon. Being a third-party seller won’t cut it.
If you don’t see the Brand Analytics option in your Seller Central account, it means you can’t access the feature.
The question is: How does Amazon determine who can use the Amazon Brand Analytics tool?
Amazon Brand Registry eligibility requirements are right, so not every seller can get in. Here are some of Amazon Brand Analytics’ eligibility requirements.
- Amazon Brand Analytics is only available to sellers who already own a brand.
- The seller must not be a third-party seller and should be internal to the brand.
- The Amazon Brand Registry should acknowledge the seller.
- The brand owner must have an active or pending trademark registration.
- The trademark for the brand must be in the form of an image-based mark (with words, letters, or numbers) or a text-based mark (with words)
- Third-party resellers and distributors are not brand owners, even though they sell branded products.
How To Find the Brand Analytics Tool
Here’s how to find the Amazon Brand Analytics tool.
- Go to the Amazon Seller Central website and sign in to your account.
- Look for the Brands option on the menu bar in the top-right corner of your Seller Central account page.
- Click Brand Analytics on the dropdown menu that appears.
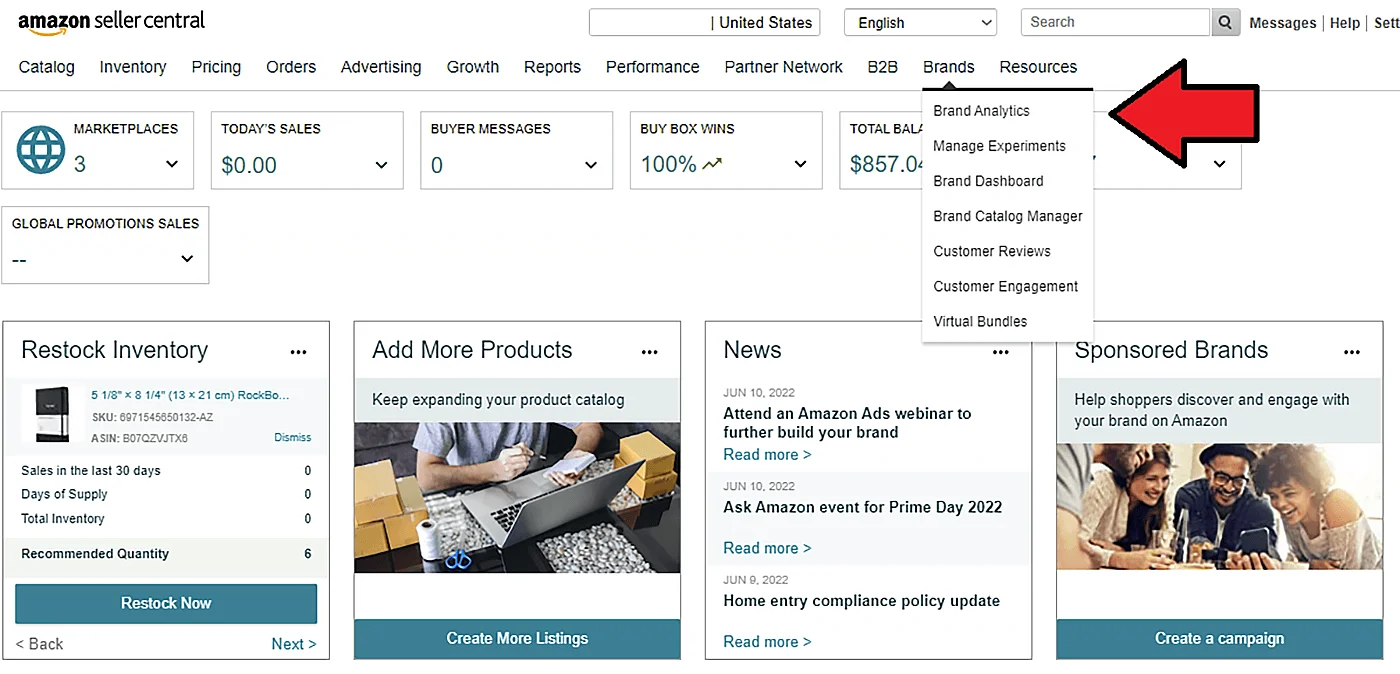
You’ll see the Amazon Brand Analytics or Consumer Behaviors Dashboard.
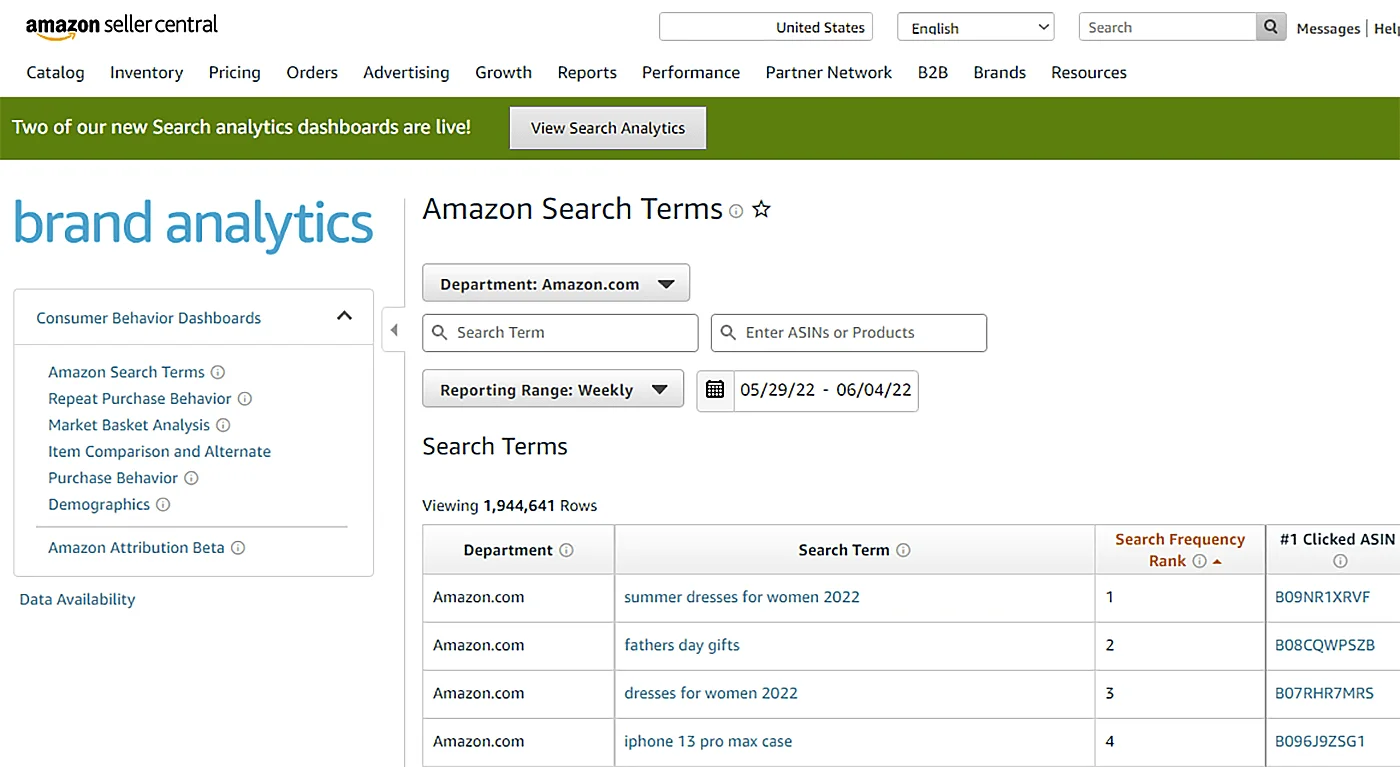
On this page, you can the following Brand Analytics tools:
- Amazon Search Terms
- Repeat Purchase Behavior
- Market Basket Analysis
- Item Comparison and Alternates
- Customer Purchase Behavior
- Demographics
The Analytics brand dashboard provides valuable data insights and key metrics. These will help you make better decisions regarding marketing campaigns, retargeting ads, consumer buying behavior, and more.
If you own a brand on Amazon, access to this tool is crucial to your success. The information from these tools will give you an advantage over your competition, especially if you know how to use them wisely.
Furthemore, it can the difference between success and failure in an extremely competitive marketplace like Amazon.
What Are the Different Amazon Brand Analytics Tools?
Here are the different analytics you can access on Amazon Brand Analytics.
Amazon Search Terms Report
The Amazon Search Terms report lets you know how how customers find your products on Amazon. It also lets you see how customers find your competitor’s products.
Knowing the keywords and search terms that customers use to find your product detail page is crucial information that is vital to your success. It lets you optimize your content around these search terms, letting you rank higher on Amazon’s search results.
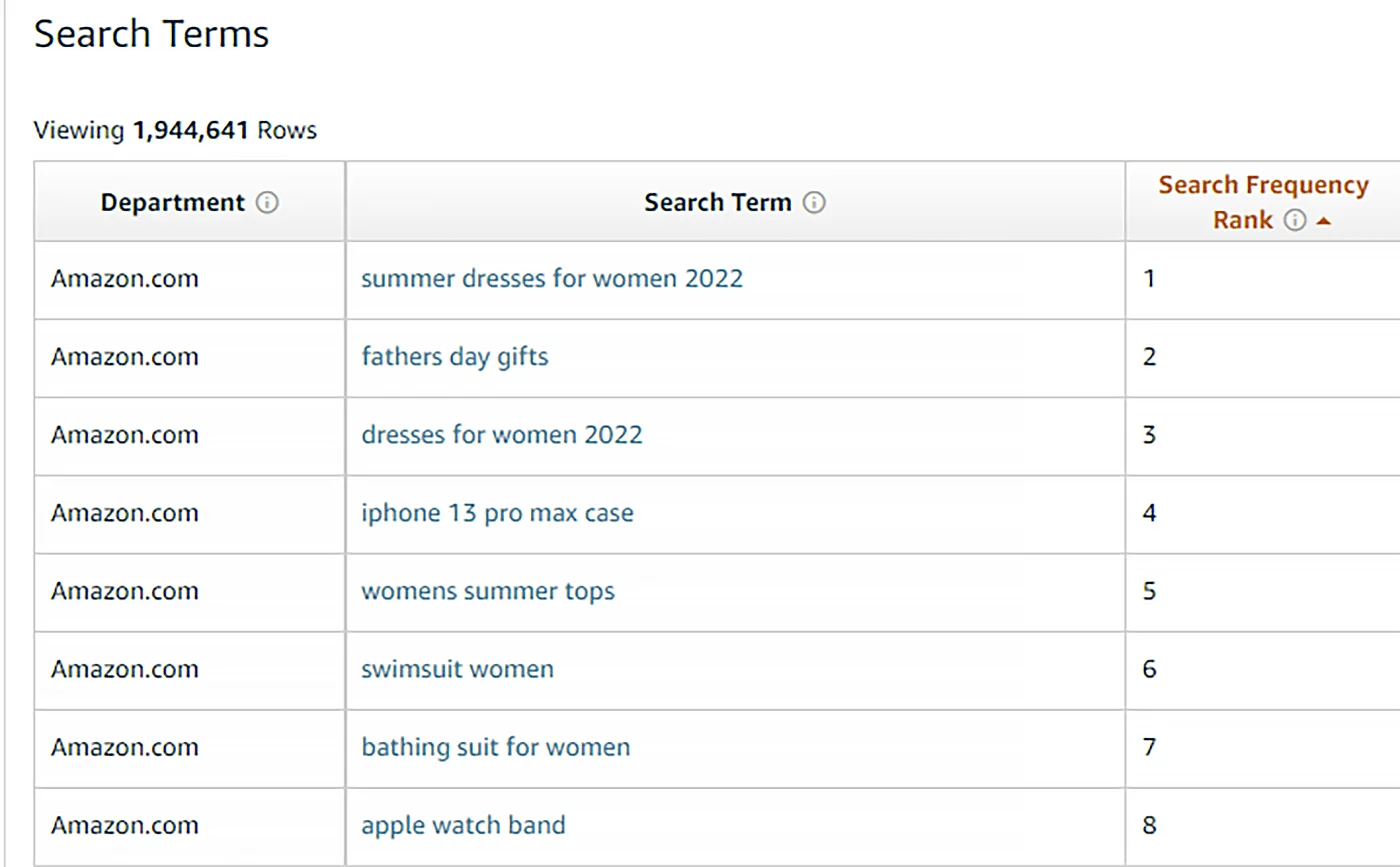
Search Terms
Search Terms are the keywords that customers use to find your (or your competitor’s) products.
You have two options when trying to find the search terms:
- Enter keywords related to your niche.
- Enter the product’s ASIN.
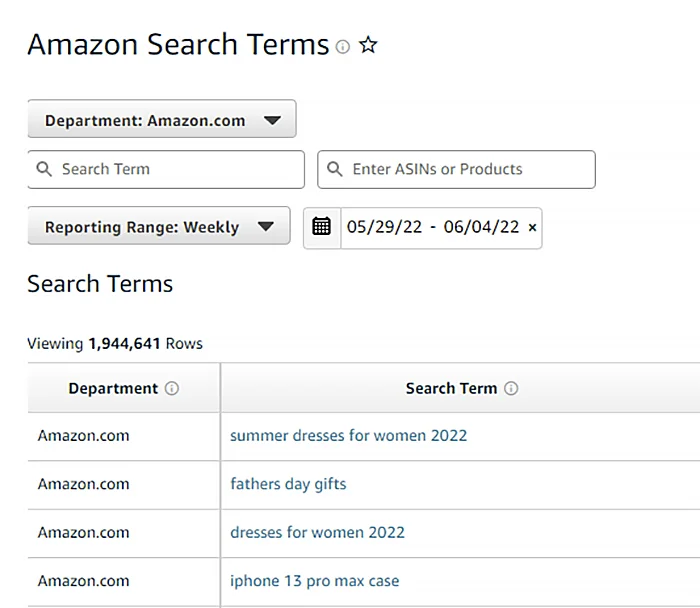
Here’s an example:
I entered the keyword toys for dogs in the Search Term field.
Here are the results:
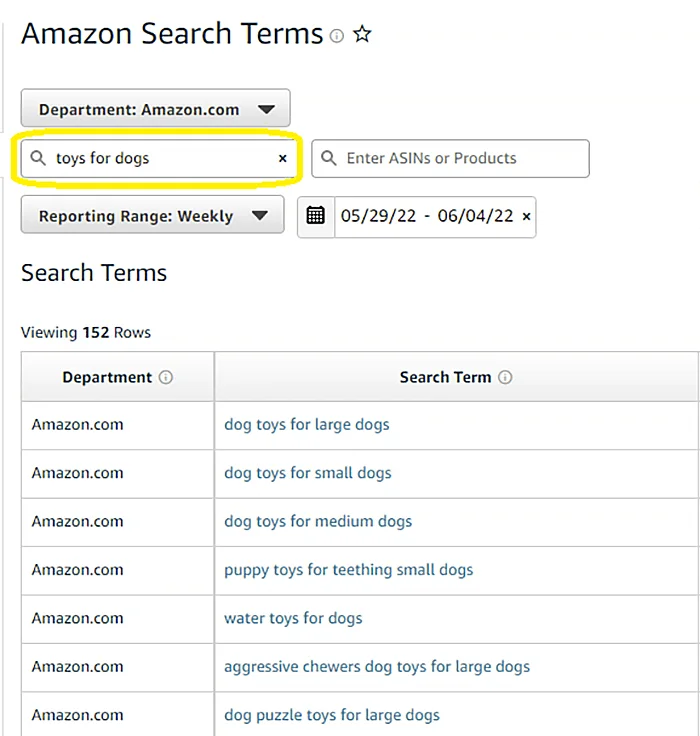
The tool displays the Different terms related to the initial search term.
Besides the initial search term, customers use these other keywords (such as dog toys for large dogs) to find products on Amazon.
You can also try entering a product’s ASIN on the search field to see the keywords customers use to find your product.
Here’s an example:
I used the ASIN (B0876PRL18) to find the Amazon search term report containing the keywords:
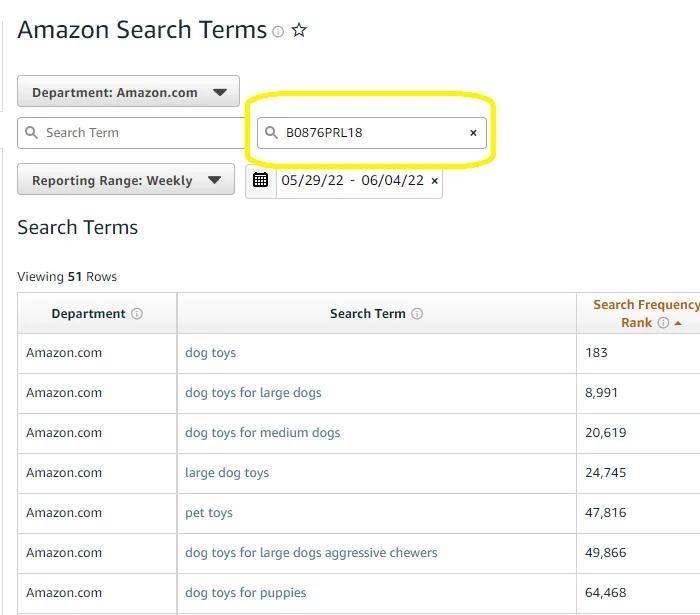
The ASIN (B0876PRL18) ranks high for the following keywords:
- Dog toys
- Dog toys for large dogs
- Dog toys for medium dogs
- Large dog toys
- Pet toys
By entering related search terms, Amazon customers found the product listing connected to the ASIN (B0876PRL18) more frequently.
Optimizing your listings and targeting these keywords lets you direct more traffic to your product listings.
Search Frequency Rank
Search Frequency Rank (SFR) is the numeric rank of a search term’s popularity over all the other terms in a specific period.
The lower the SFR’s number, the more popular the search term.
Here’s an example:
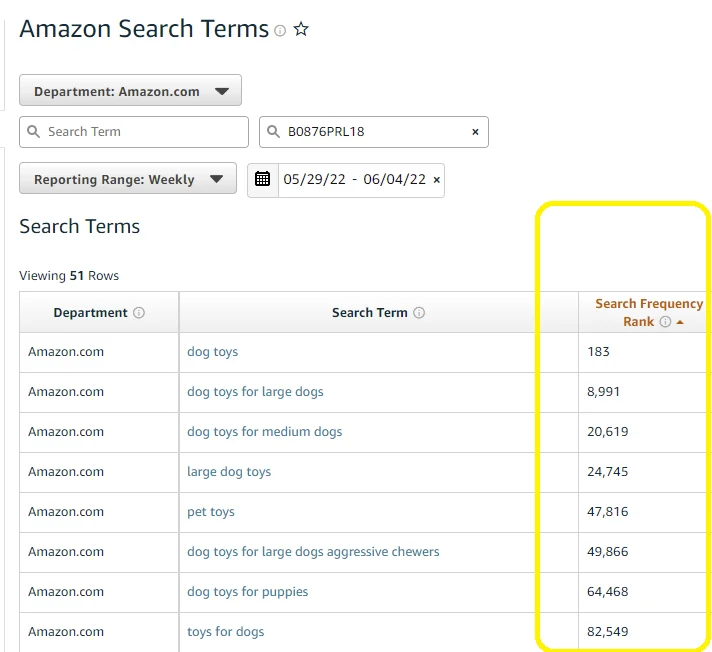
My previous example shows the keyword dog toys has a Search Frequency Rank 183.
Meanwhile, the keyword toys for dogs has a Search Frequency Rank of 82,549.
These rankings mean more customers use dog toys to find the product (B0876PRL18) than toys for dogs.
Click Share and Conversion Share
Click Share and Conversion Share indicate the product’s clickthrough and conversion rates.
Click Share determines the percentage of customers who clicked on the product after searching for a particular term.
Conversion Share determines the percentage of customers who bought the product after searching for a particular term.
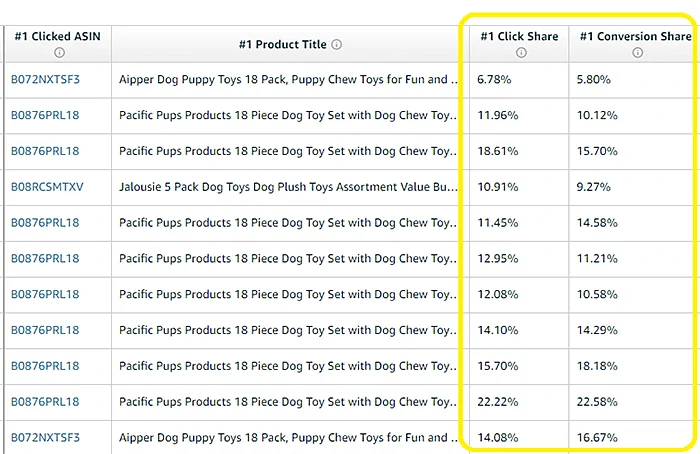
My previous example used the search term toys for dogs.
The result shows a product called Aipper Dog Puppy Toys, 18 Pack in the first spot, meaning when customers searched toys for dogs, 6.78% clicked on Aipper Dog Puppy Toys.
Meanwhile, 5.80% of customers buy Aipper Dog Puppy Toys after searching toys for dogs.
If you can isolate the terms with the highest clicks and conversions for your products, you can improve your advertising campaigns.
Clicked ASIN
Clicked ASIN shows the top products that customers click on after searching for a keyword on Amazon.
However, it doesn’t always mean that the product that ranks first on Amazon’s search results is the #1 Clicked ASIN.
Sometimes, a product that ranks lower on the search results can have a higher Clickthrough Rate, which is where the Clicked ASIN data comes in.
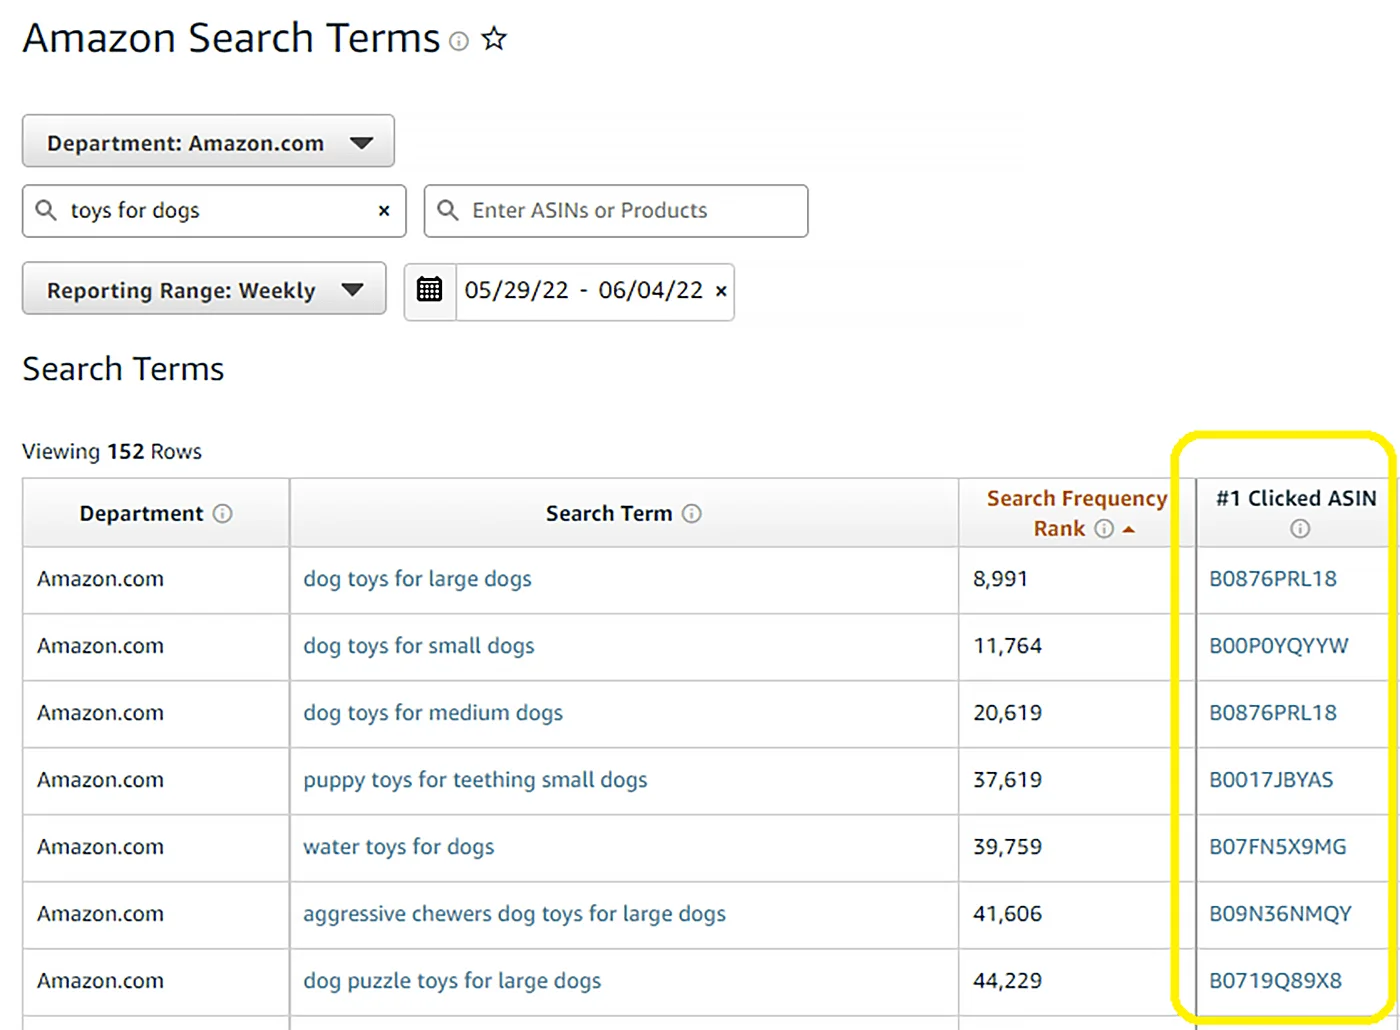
The search term dog toys for large dogs has the ASIN B0876PRL18 as the #1 Clicked ASIN.
The same ASIN (B0876PRL18) also ranks for dog toys for medium dogs.
An ASIN can be the #1 Clicked ASIN for multiple search terms, helpful information if you want to research the top competitors in your niche.
Amazon Brand Analytics returns the top 3 Clicked ASINs, letting you spy on your top three competitors.
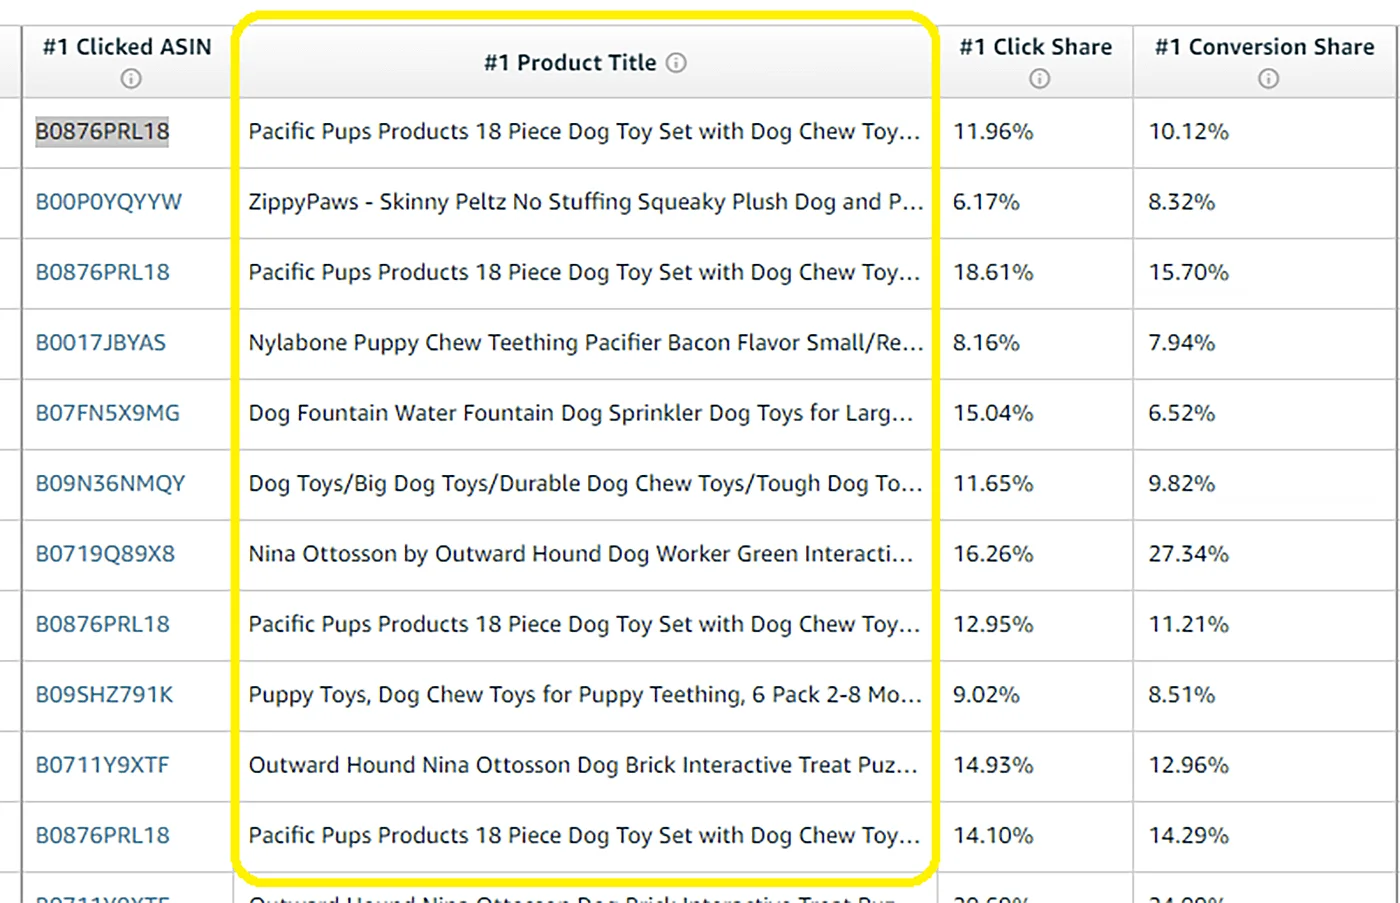
Product Title
Product Title is similar to Clicked ASIN.
However, instead of returning the ASIN, Product Title provides the top product for a specific search term.
Market Basket Analysis
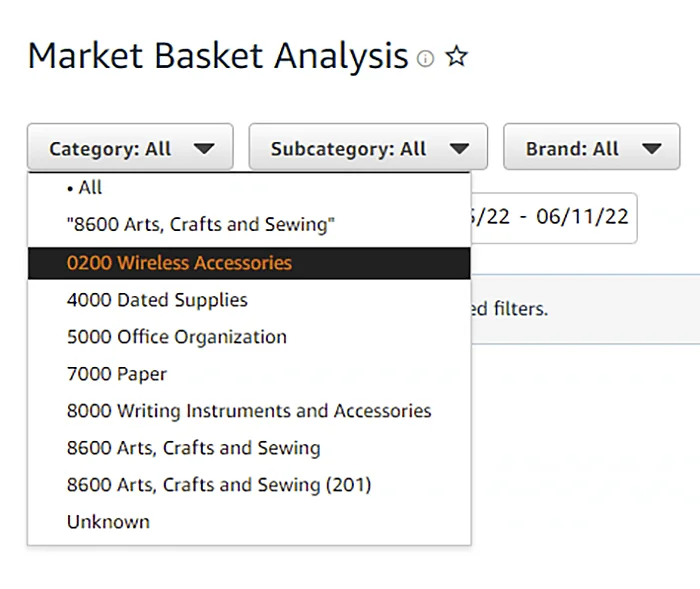
Market Basket Analysis shows you the other products shoppers purchase most frequently with your products.
This information is essential because it can provide bundling and cross-marketing opportunities.
Here’s an example.
I am selling apples, oranges, and grapes in my store.
If the Market Basket report tells me that 80% of customers who buy apples also buy grapes, bundling apples and grapes would be beneficial.
I can sell more apples and grapes at the lower bundle price and make my customers happier simultaneously.
Purchased ASIN
The Purchased ASIN is the product customers buy most frequently over your product.
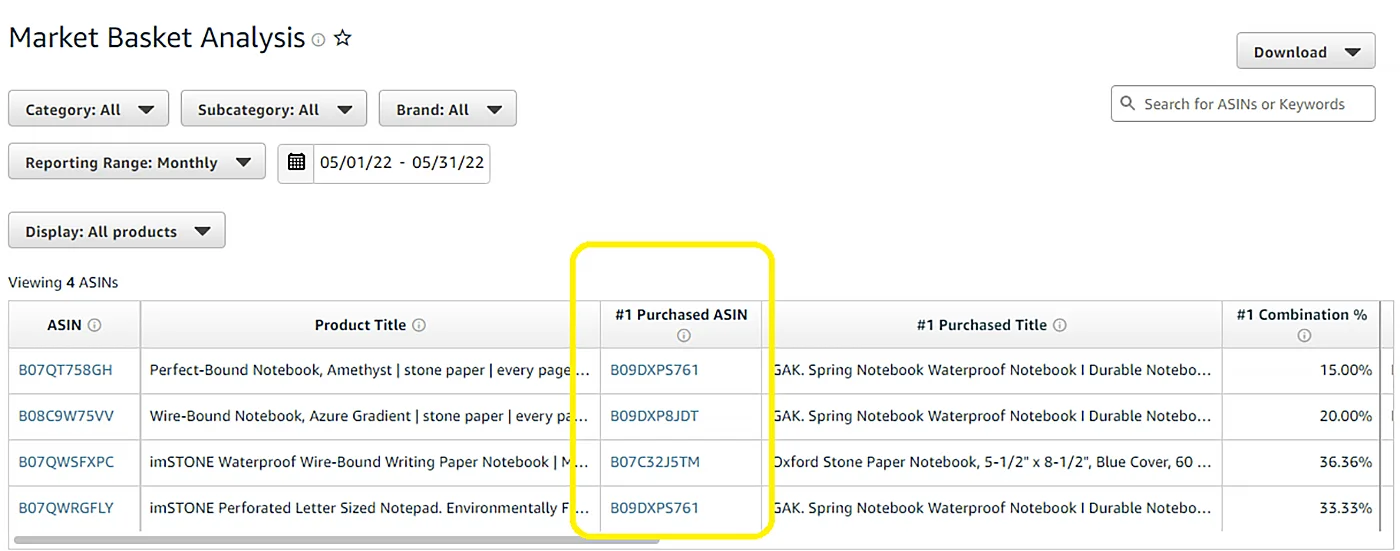
The brand owner’s bestselling product, Perfect-Bound Notebook Amethyst (with ASIN B07QT758GH).
However, customers prefer the GAK, Spring Waterproof Notebook (with ASIN B09DXPS761) Thus, the #1 Purchased ASIN is B09DXPS761.
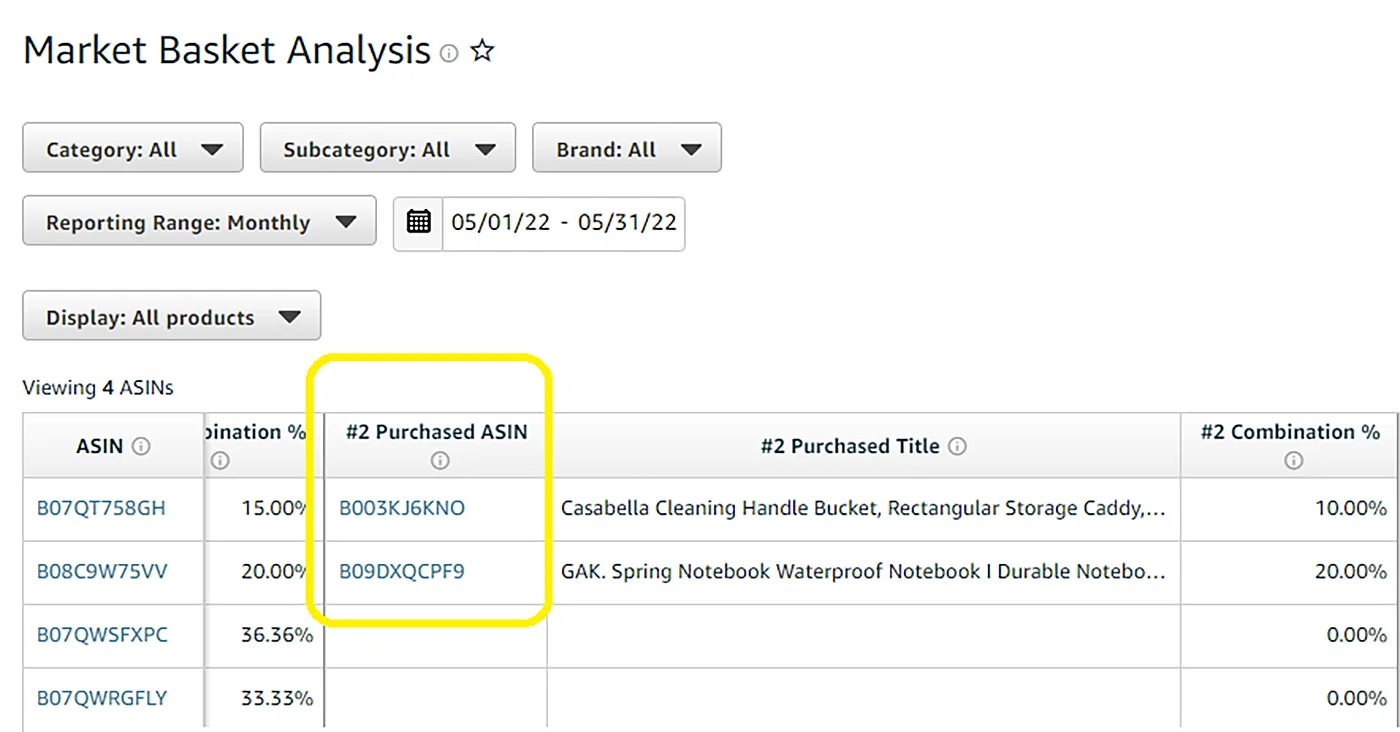
If you scroll to the right, you’ll see the #2 Purchased ASIN (B003KJ6KNO).
The #2 Purchased ASIN is the second most popular product bought over your product.
Market Basket Analysis returns only the top 3 ASINs, meaning you can only see up to the #3 Purchased ASIN for every brand product bought within the reporting range.
Purchased Title
Purchased Title shows the title of the Purchased ASIN associated with your brand product.
In the example below, GAK. Spring Notebook Waterproof Notebook is the #1 Purchased Title alongside the brand owner’s product, Perfect-Bound Notebook, Amethyst Stone Paper.
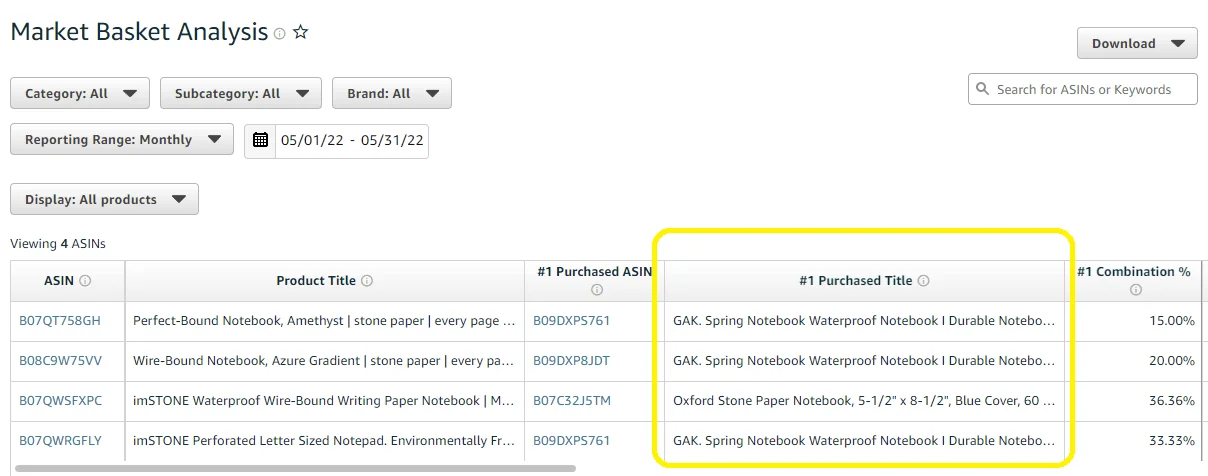
Like all the other Amazon Brand Analytics, Purchased Title shows only the top 3 entries.
Combination %
Combination % is the percentage of orders that contain both the brand owner’s product and the competitor’s most purchased product.
This percentage compares the total number of orders containing at least two different products, including the brand owner’s listed product.
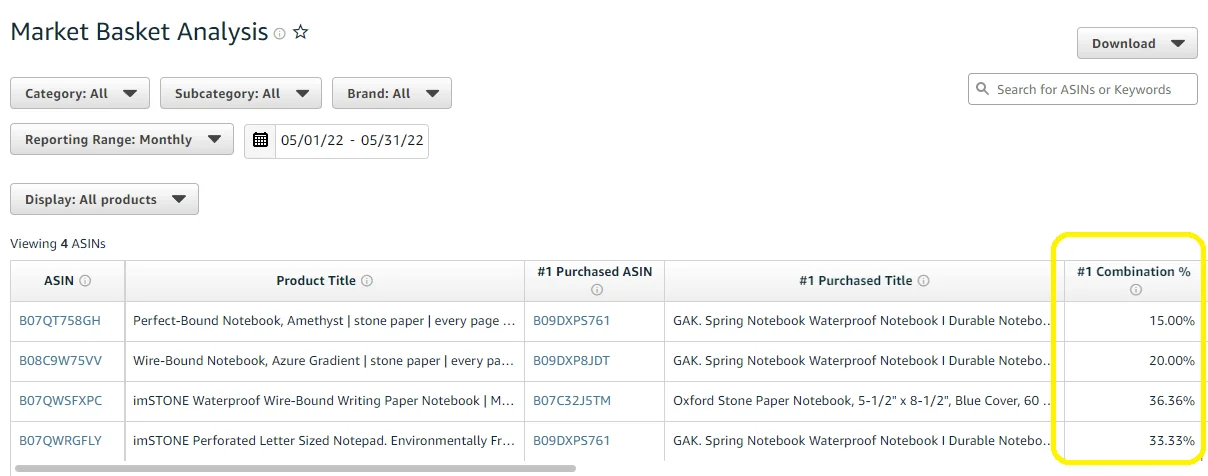
The higher the Combination %, the more frequently customers buy your products with the listed product.
You can cross-market your products with the competitor products listed in the Market Basket Analysis report.
Item Comparison and Alternate Purchase Behavior
Before making a purchase, customers often compare multiple products to see which one fits their needs.
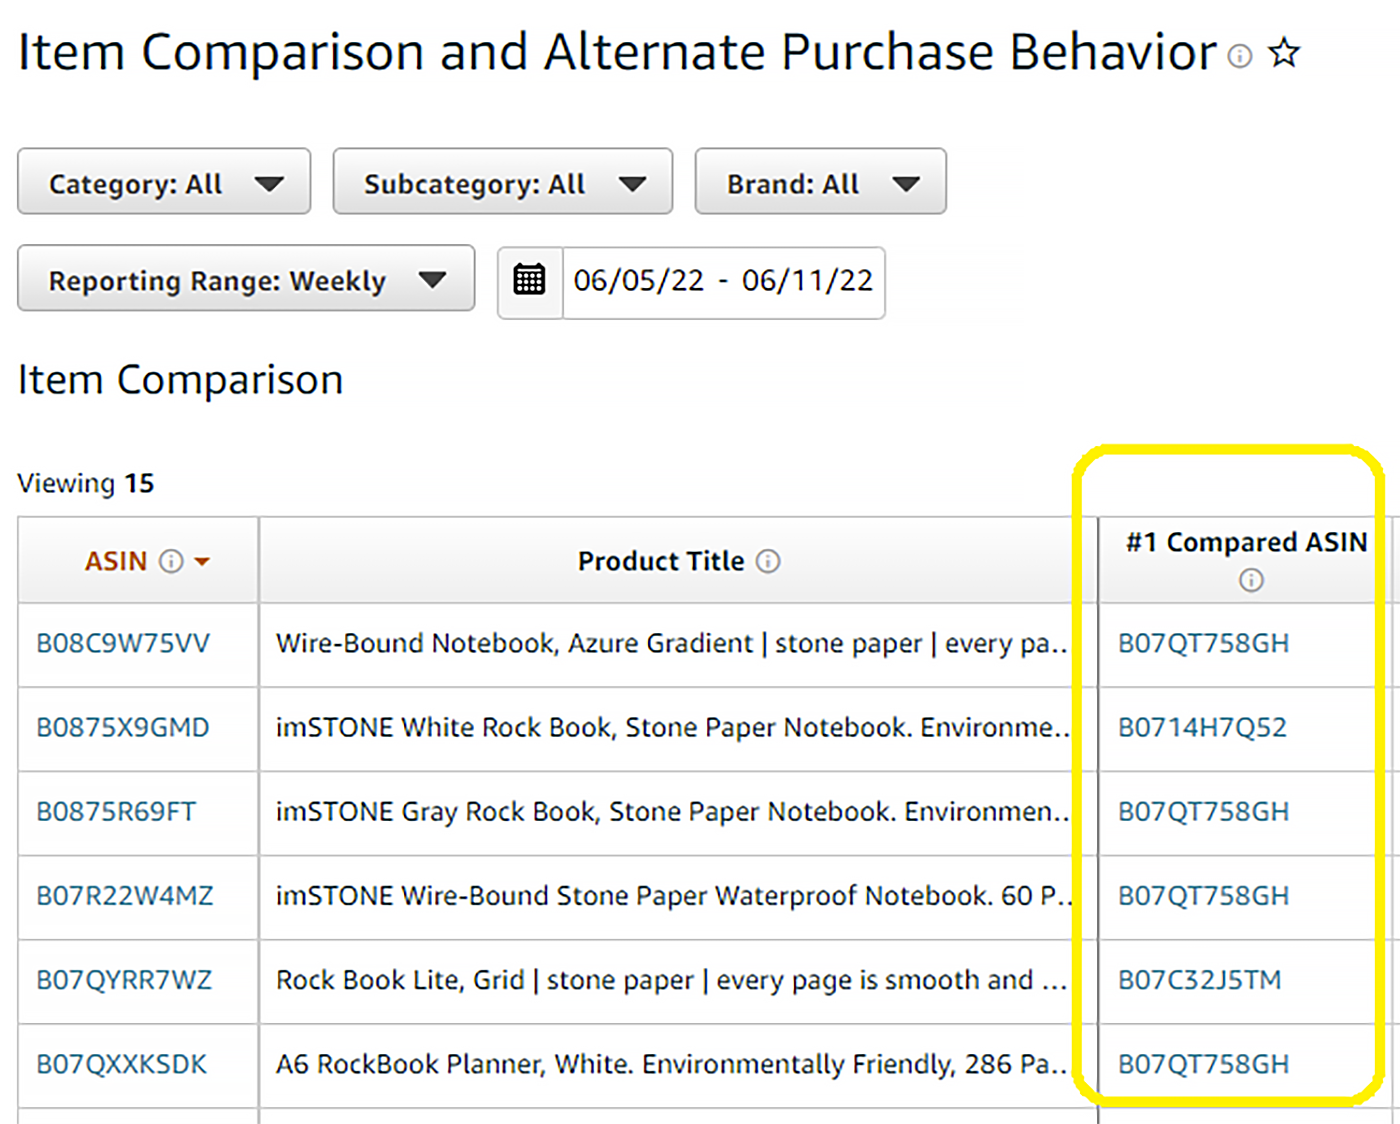
Item Comparison and Alternate Purchase Behavior lets you know the other products customers compare with yours.
The Item Comparison and Alternate Purchase Report shows the competitors’ products that Amazon customers frequently viewed and bought on the same day as your products.
This data lets you see directly competing products, helping you make better marketing strategies and advertising decisions.
Compared ASIN
Compared ASIN is the competitor ASIN shoppers compare most frequently with your products.
This data lets you see whenever a customer browses your product listing and compares your product with a competitor’s.
In the example above, the ASIN that shoppers compare most frequently with the brand owner’s product is B07QT758GH.
Clicking on the ASIN gives you more product details.
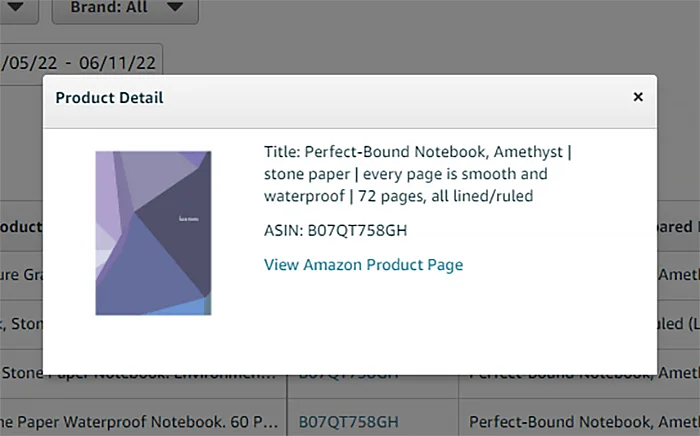
NOTE: The Compared ASIN can also show one of your own products, not just a competitor’s ASIN.
Compared %
Compared % shows the rate at which shoppers viewed another product the same day they viewed your products.
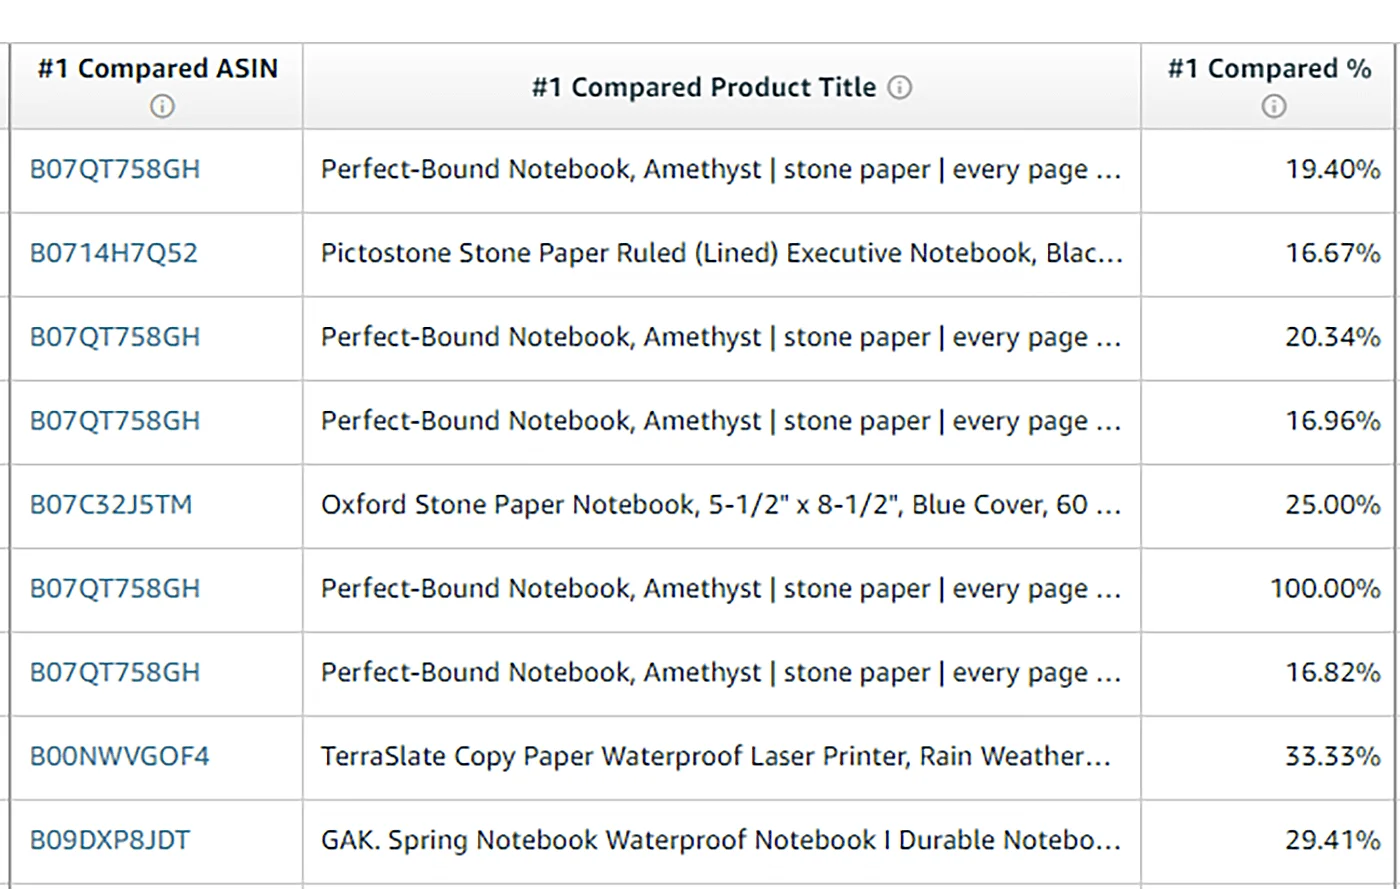
The higher the percentage, the more frequently Amazon shoppers viewed a product alongside yours.
Purchased ASIN
You can find Purchased ASIN data in the Alternate Purchase section.
Purchased ASIN is the product shoppers buy most frequently after viewing your product.
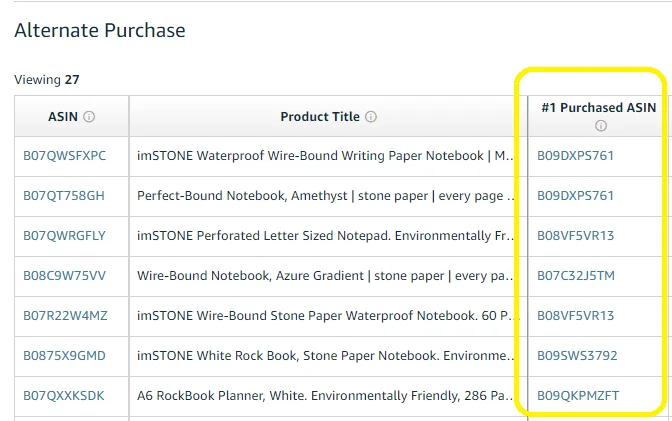
This data lets you see when a customer views your product, compares it to another ASIN, and purchases that product instead.
Purchased %
Purchased % is the rate at which customers buy a competitor’s product over yours after comparing the two.
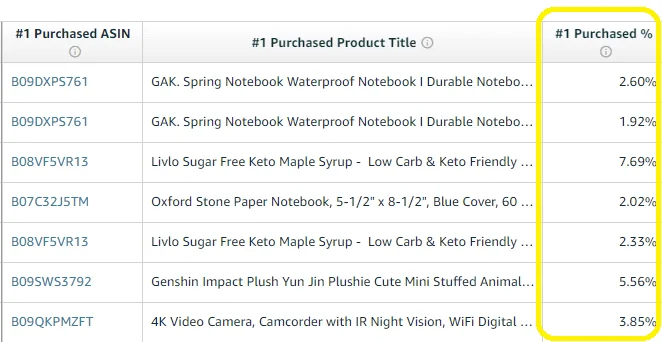
The Purchased % field contains the percentage of customer orders that contained the Purchased ASIN, in comparison to the total number of alternative product orders.
The higher the Purchased %, the more frequently the customer purchased the competitor’s product after viewing your product.
Demographics
The Demographics Report lets you know who your customers are, where to find them, and how to reach them. This data helps you improve your marketing strategies.
The Demographics report shows the aggregate breakdown of sales of a Brand owner’s ASINs according to the following data:
- Customer age
- Household income
- Education
- Gender
- Marital status
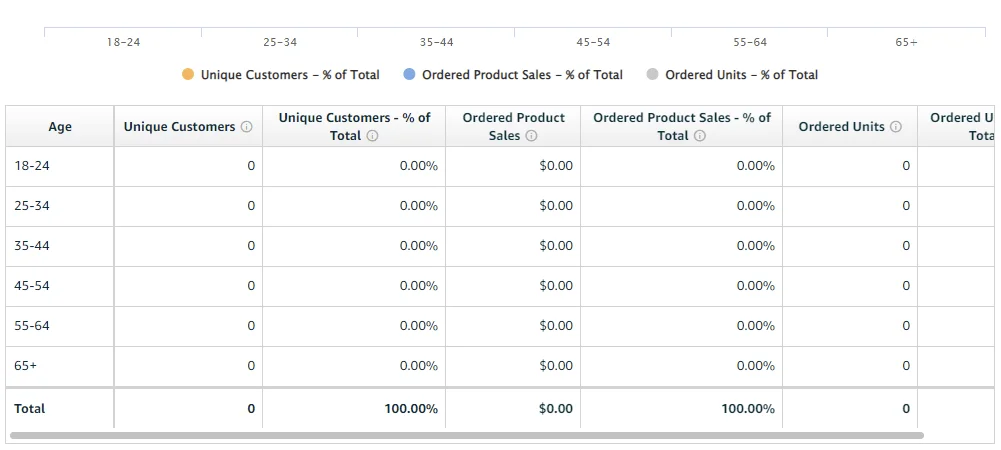
The Demographics report shows your products in the Brand Registry.
However, only products with 100 or more unique customers within the given time period will show up in the Demographics report.
Knowing the age, household income, education, and gender of your customers can be game-changer.
For example, males between 24 to 54 years purchase chess products more than females of the same age.
With this information, you can focus your marketing efforts on targeting males between the ages 24 to 54 using Amazon PPC Campaigns.
Repeat Purchase Behavior Report
Repeat Purchase Behavior how many of your customers are repeat customers and which of your products have repeat purchases.
The Repeat Purchases report lets you know the number of orders you received for each of your products.
It also shows the number of unique customers who placed the orders and the percentage of customers who made a repeat order.
By comparing the number of orders with the number of unique customers, you can identify which products customers order repeatedly.
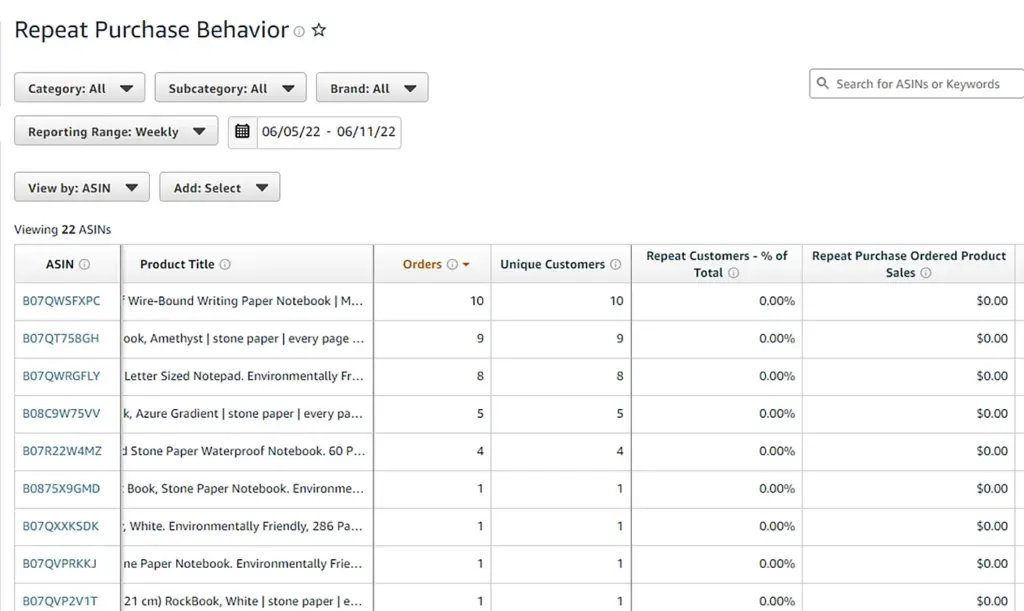
The more repeat purchases a product has, the more customer loyalty it generates for your brand.
You can use this information to promote your most successful Repeat Purchase Products in your Amazon Storefront, helping your generate sales.
What Are the Benefits of the Amazon Brand Analytics Tool?
Here are some of Amazon Brand Analytics’ benefits.
It Helps With Keyword Research.
Keyword research is an important task for many Amazon Sellers.
Knowing the search terms that customers use to find your product, and how frequently they use these keywords, is crucial to your success. It allows you to make informed decisions on your marketing strategies, as well as your PPC advertising campaigns.
You can also optimize your listings using the keyword suggestions from Amazon Brand Analytics and improve your organic rankings.
It Helps Improve Your Marketing Strategies.
Amazon Brand Analytics tool can help you improve your marketing strategies, without spending a significant amount.
For example, you can use the Repeat Purchase Behavior report to determine which of your products generate repeat customer purchases. Then, you can aggressively push these products in front of your customers using paid Amazon PPC campaigns.
It Helps You Understand Your Audience.
Demographics report from Brand Analytics shows the age, gender, household income, and education level of your most profitable customers.
As a brand owner, you can now accurately target these customers to generate more sales for your Amazon store.
Amazon Brand Analytics Terms & Conditions
There are specific terms and conditions you must follow to use the Amazon Brand Analytics (ABA) tool.
Let’s discuss some of these conditions.
Access to Information
By using this tool, you give Amazon access to information related to your brand’s products. You also give Amazon access to your sales data and other information.
Amazon has the right to use this information however it wants.
Ownership and Usage Rights
You give Amazon the right to use your information by signing up for ABA.
While Amazon owns the rights to all the information, they also grant you revocable, non-exclusive, and limited access to ABA.
Of course, you can only use this for internal business purposes. You cannot sell the access or license to use ABA.
Confidentiality
Amazon provides this information for free. As such, Amazon expects you to keep the information confidential unless otherwise stated.
Amazon only allows using the ABA tool for permitted business purposes.
If they think you are abusing the ABA tool, the platform reserves the right to take actionable measures on your account.
Frequently Asked Questions (FAQs)
Is Amazon Brand Analytics Free?
Yes. Amazon Brand Analytics is free if you’re eligible and meet Amazon Brand Registry’s criteria to use the tool.
Who Can Use Amazon Brand Analytics?
Only Brand owners who register with the Amazon Brand Registry can use Amazon Brand Analytics.
Third-party sellers or distributors can’t use Amazon Brand Analytics.
Which Products Appear on Amazon Brand Analytics Reports?
Amazon Brand Analytics reports will include all the products the brand owner has registered within the Amazon Brand Registry.
The ASINs from competitors associated with the brand owner’s registered products also appear in the ABA reports.
The Bottom Line
Amazon Brand Analytics provides important insights to help brand owners like you make strategic, data-driven decisions for your stores.
The Demographics and Market Basket Analysis reports can help you improve your advertising campaigns and marketing strategies.
I hope my guide has helped you understand what Amazon Brand Analytics is and how it can benefit your brand.
Use the information you learned in my guide to maximize the data on Amazon Brand Analytics and take your brand to the next level.
Besides Amazon Brand Analytics data, you must also know how to write product descriptions that sell if you want to boost your brand and foster customer loyalty.


