Amazon is one of the most competitive ecommerce brands in the world. It offers a platform that links sellers and buyers with various products and services.
With millions of customers shopping on Amazon, it’s definitely a go-to platform for online sellers.
However, the fierce competition among thousands of sellers also means you need to beef up your business strategies. The best way to start is to arm yourself with the relevant data.
In this article, I’ll tackle all the latest Amazon marketplace statistics, from seller and product statistics to consumer usage and behavior.
Let’s begin!
Amazon Growth
- The company was responsible for over $469,822 billion in annual revenue in 2021 and $116,444 billion in quarterly revenue in 2022.
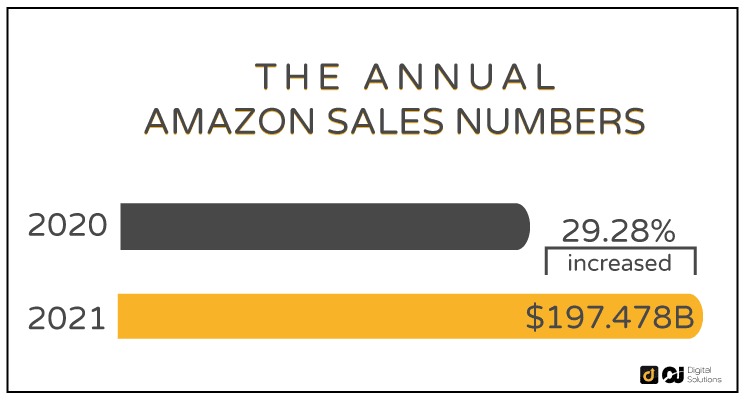
- The annual Amazon sales numbers for 2021 were $197.478 billion, with a 29.28% increase from 2020.
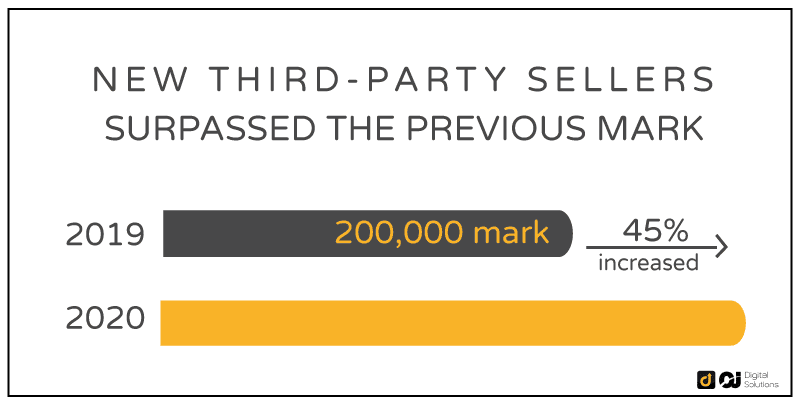
- In 2020, new third-party sellers worldwide surpassed the previous 200,000 mark by more than a 45% increase from 2019.
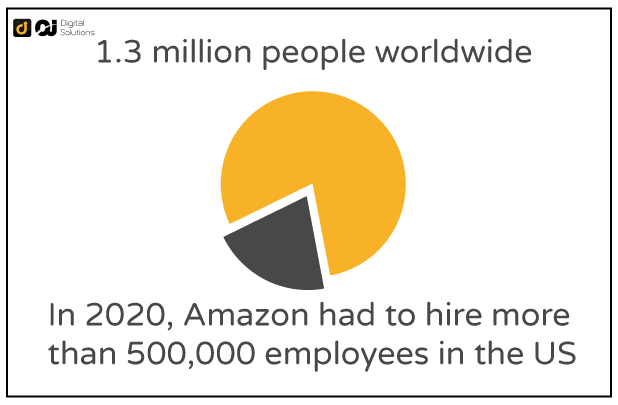
- In 2020, Amazon had to hire more than 500,000 employees in the US and 1.3 million people worldwide to run things smoothly.
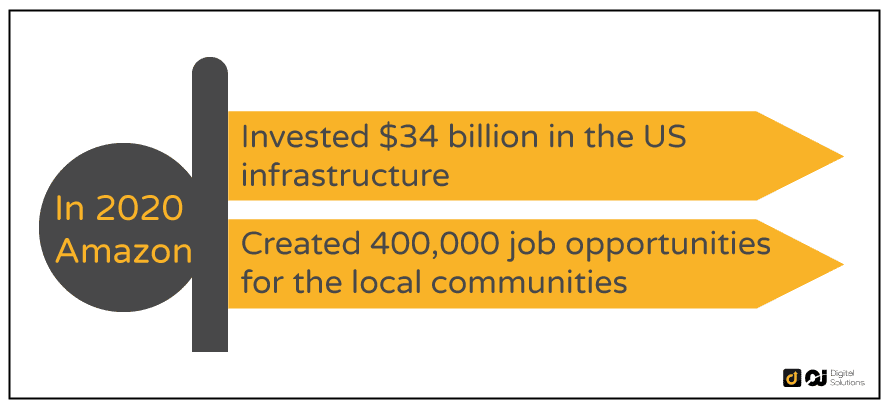
- Amazon invested $34 billion in the US infrastructure and created 400,000 job opportunities for local communities in 2020.
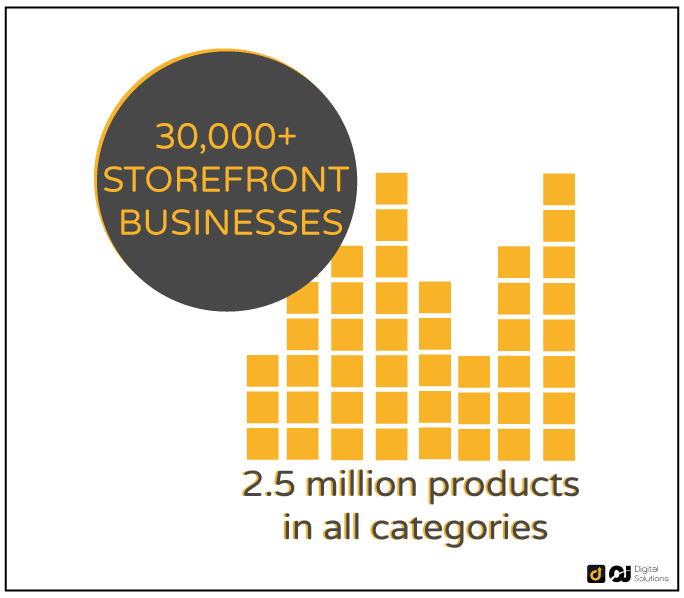
- More than 30,000 storefront businesses have migrated to selling their products on Amazon and have featured a little over 2.5 million products in all categories.
- By 2020, over two million small and medium-sized businesses were Amazon third-party sellers.
- Amazon has pledged to hire over 100,000 US veterans and military spouses as a way of giving back by 2024.
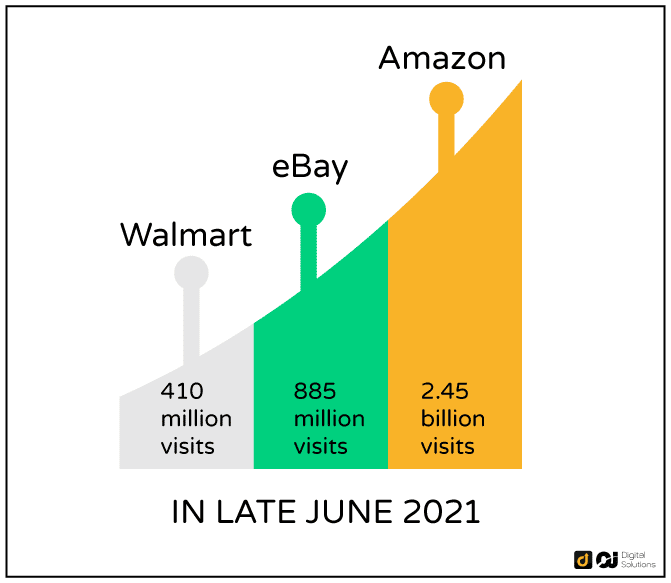
- In late June 2021, Amazon recorded the highest number of ecommerce site visits, with approximately 2.45 billion monthly visits.
It ranked higher than eBay, with more than 885 million visits per month, and Walmart, with 410 million visits per month.
Amazon Seller Statistics
- Third-party sellers started selling on Amazon.com in 1999. Now, the sellers’ accounts have grown to 58%.
- There are more than 9.5 million registered Amazon sellers globally.
- Over 500,000 third-party sellers on Amazon live in the US; 9.1 million sellers worldwide, 2.3 million active sellers, and 1 million new sellers joined in 2020 alone.
- In the second quarterly report of 2020, third-party sellers sold over 53% of merchandise.
- More than 130,000 third-party sellers hit the $100,000 mark by the end of 2020.
- On Black Friday, Cyber Monday, Easter, Thanksgiving, and Christmas, the third-party sellers made 11,500 Amazon transactions per minute.
- Amazon ranks seventh as an ecommerce brand based on ease of use, profitability, communication, and customer service. eBay tops the list with an average rating of 6.53 out of 10.
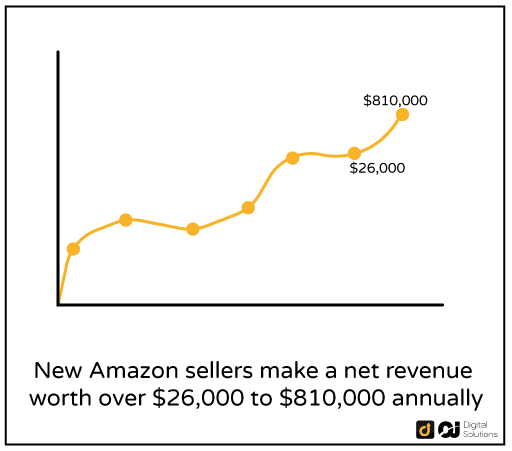
- New Amazon sellers make a net revenue worth over $26,000 to $810,000 annually.
- Most customers search for products on Amazon and other sites to compare prices and quality.
- The number of sellers on Amazon grows by around 3,700 every day, proving that there’s a demand for third-party sellers on the platform.
- Of the 73% of businesses selling on Amazon, each has 1 to 5 employees, while at least 7% have more than 50%.
- The average Amazon member spends $700 yearly, while Amazon Prime members spend $1300 annually. This means that sellers using the FBA account have more visibility and better sales from Prime buyers.

- The top Amazon sellers use the FBA program to sell their products and services.
- The top 10 SMB Amazon sellers per capita states are Iowa, Delaware, California, Wyoming, New Jersey, Vermont, New York, Utah, New Hampshire, and Florida.
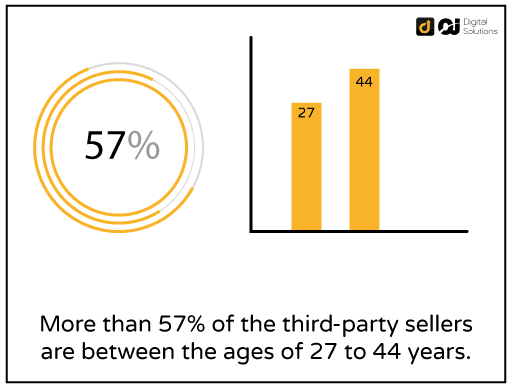
- More than 57% of the third-party sellers are between the ages of 27 to 44 years.
Usage By Device
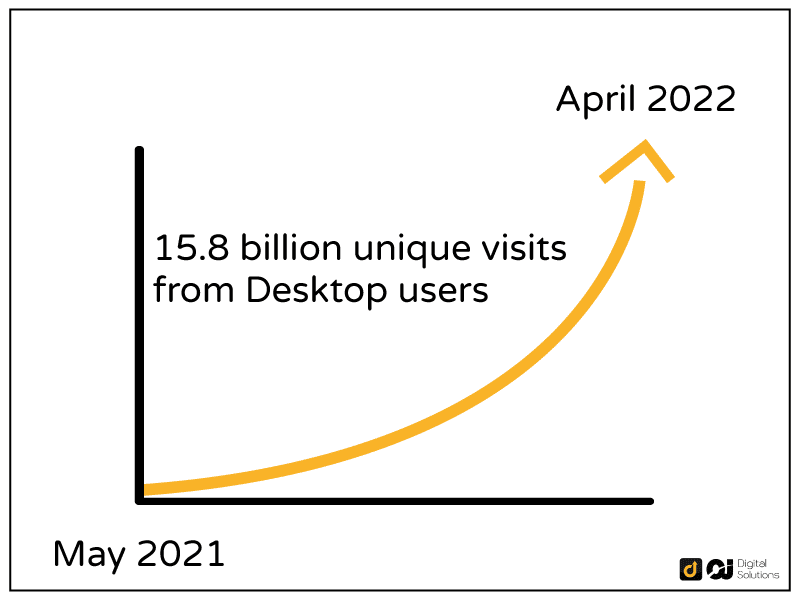
- Between May 2021 and April 2022, Amazon received over 15.8 billion unique visits from desktop users.
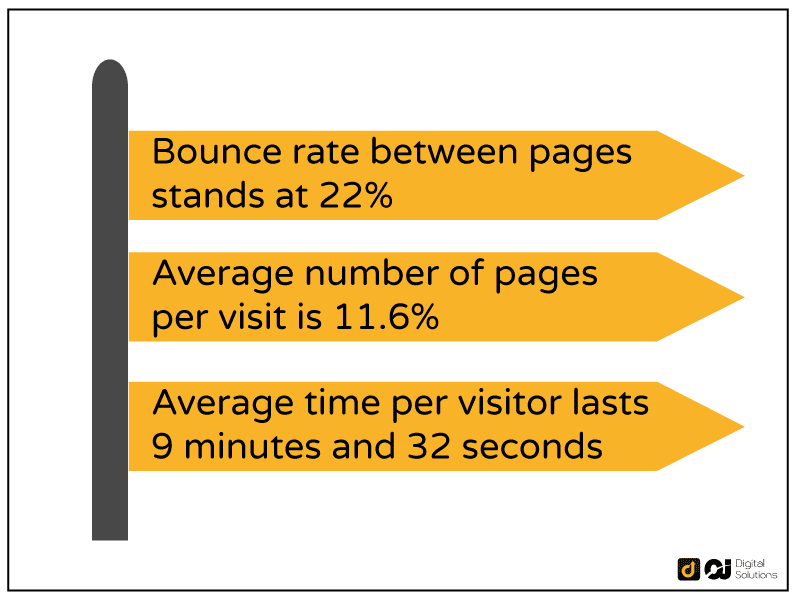
- The bounce rate between pages stands at 22%, while the average number of pages per visit is 11.6%.
- The average time per visitor lasts 9 minutes and 32 seconds.
- Amazon receives 115.2 million unique visitors without duplicating other gadgets.
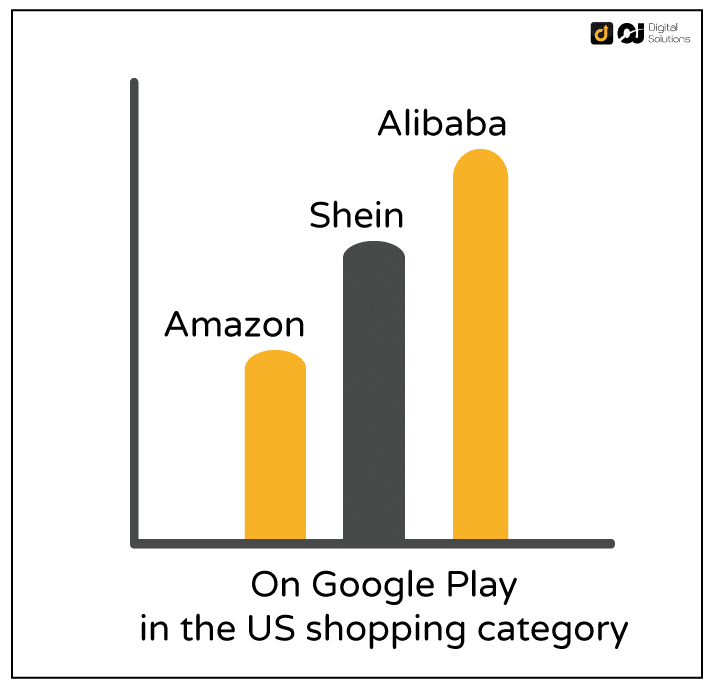
- On Google Play, Amazon ranks third after Shein and Alibaba in the US shopping category.
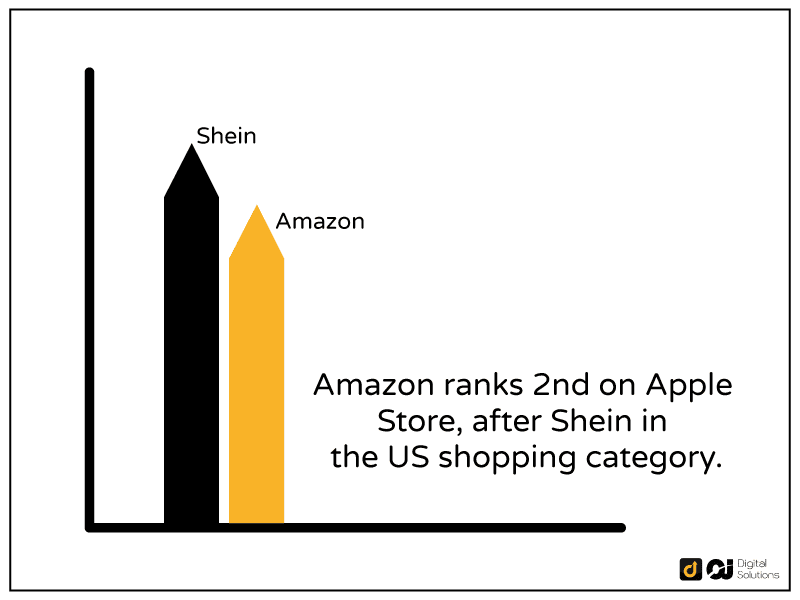
- Meanwhile, the online marketplace ranks second in Apple Store, after Shein in the US shopping category.
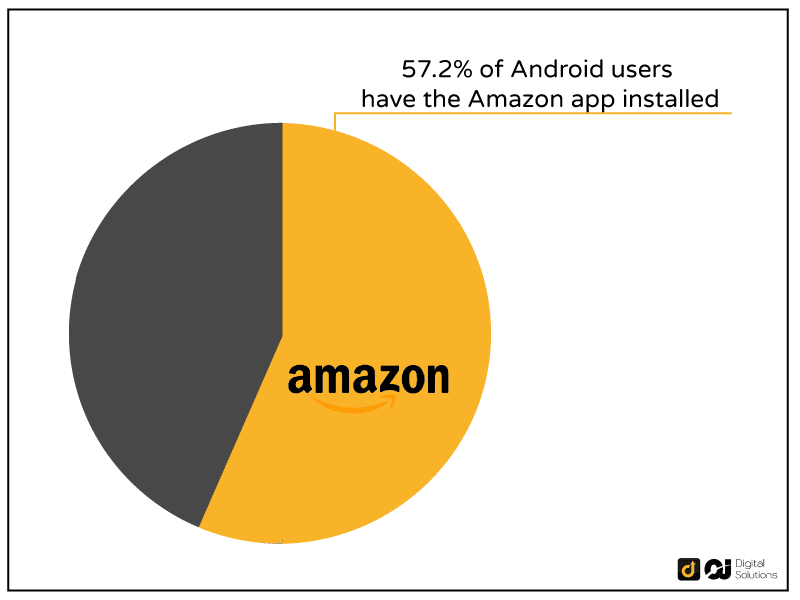
- Over 57.2% of Android users have installed the Amazon app on their devices.
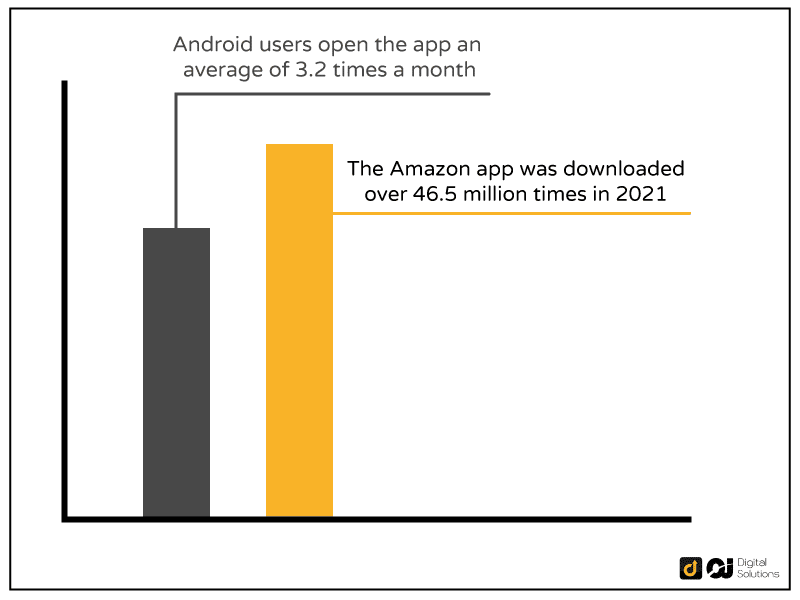
- On average, mobile users downloaded the Amazon app over 46.5 million times in 2021, and Android users open the app an average of 3.2 times a month.
Amazon Active Users Statistics
- In 2019, Amazon’s customer statistics increased to over 150.6 million, while Walmart only had 86 million.
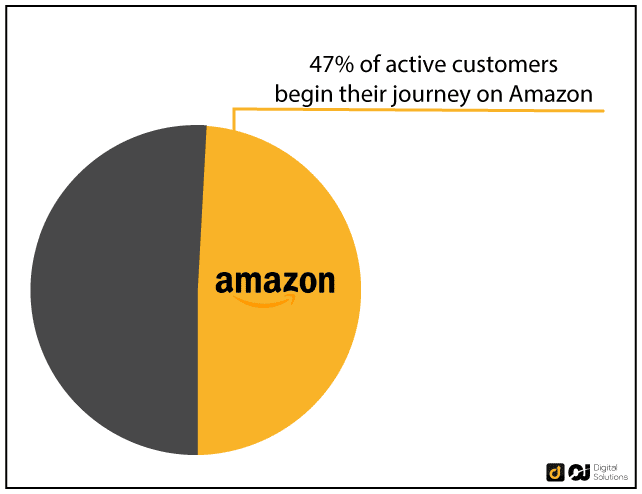
- According to customer data, more than 47% of active customers begin their journey on Amazon. Customers visit Amazon to get inspired before deciding on a purchase.
- 80% of Amazon shoppers are homeowners, which explains why home and furniture items are popular.
- On average, 51% of shoppers on Amazon are ladies, and 45% of them are married or have children.
- 82% of shoppers consider price an important factor when shopping on Amazon. Most Amazon products are priced reasonably, so keep that in mind when pricing your products.
- 66% of Amazon users state that they shop on Amazon because the site has everything they need.
- Amazon customers who choose to use a PC or laptop for online shopping are among 65+ years old, while 35-year-olds and under prefer their smartphones.
- Amazon Prime members grew by over 50% when free shipping was introduced. In fact, 9 out of 10 Amazon customers shop on the platform because of free shipping options.
This means you’ll likely get more customers if you offer free shipping.
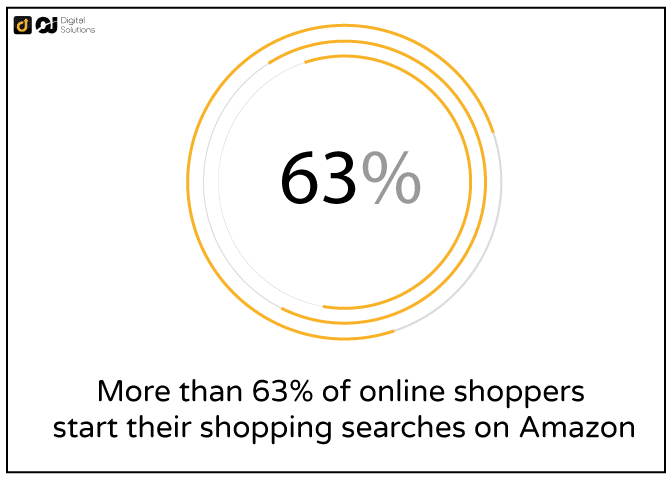
- 63% of online shoppers start their shopping searches on Amazon.
- Users with premium subscriptions also enjoy other free features like fast delivery and free TV shows. In addition, the amount of shopping has increased since 2019 due to the exclusive offers.
- Amazon allows kids aged 13-17 to have accounts approved by parents, and 28% are Amazon Prime members.
- Amazon has more than 29 million Facebook page followers, which increases the customer base by over 30%.
- 46% of Amazon Prime members purchased products weekly, while about 6% reported making daily purchases.
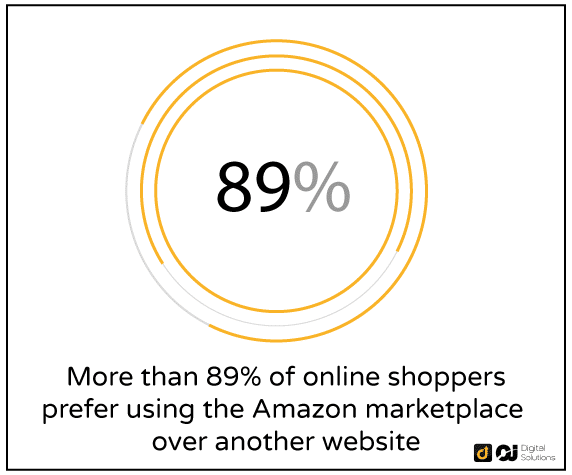
- More than 89% of online shoppers prefer using Amazon over another website, demonstrating that the platform has earned the trust of many customers.
- 41% of Amazon users read product reviews before buying a product on the platform, underlining the importance of adding reviews to your online store.
- 33% of Amazon shoppers cite Amazon’s quick response to queries as the best part of their online shopping journey with the site.
This stat points to the significance of using live chats or chatbots for better customer service.
- 19% of millennials from 27 to 32 years old purchase Amazon items daily.
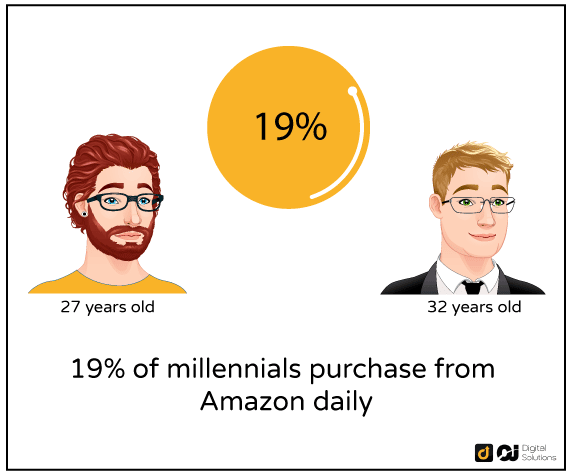
- Millennials also shop twice as often as baby boomers.
- 23% of Amazon shoppers don’t have a specific product in mind when they go on the site. They are there just to browse and find inspiration.
This shows that sellers can potentially influence buyers with intelligent marketing and SEO strategies.
- Amazon shoppers spent over $295 billion on Amazon in 2020.
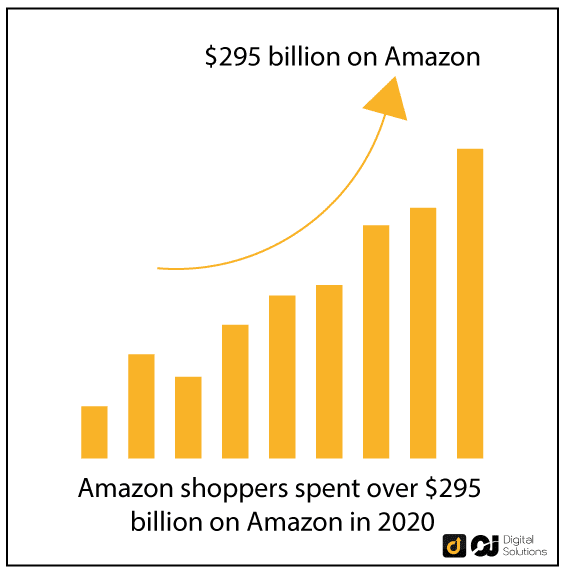
- Amazon sales statistics show sales from over 300 million shoppers around the world.
- Most customers complete their purchases in three minutes or less, and 28% take 15 minutes as they compare products before adding them to the cart.

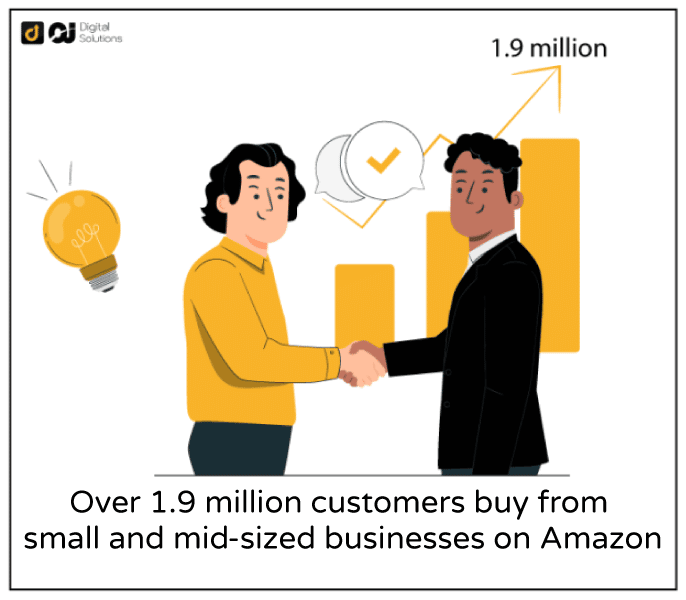
- More than 1.9 million customers buy from small and medium-sized businesses selling on Amazon.
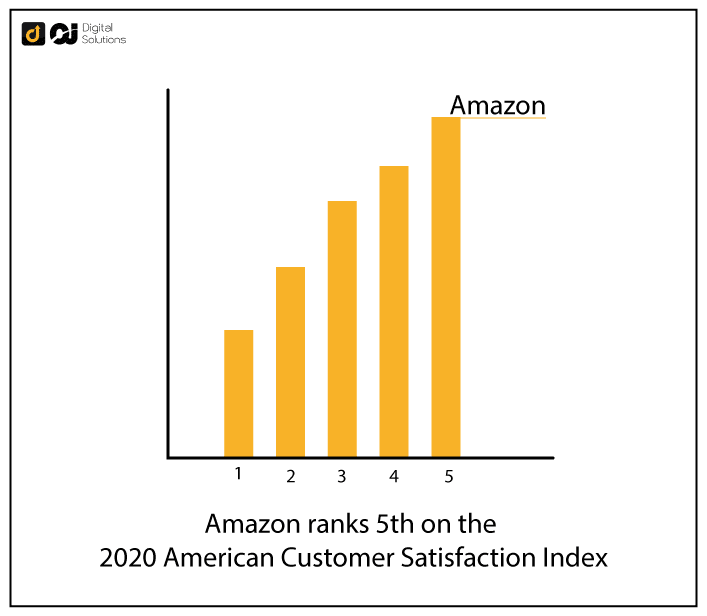
- Amazon ranks fifth on the 2020 American Customer Satisfaction Index.
- 45% of US shoppers scroll through a maximum of two search pages when looking for a product on Amazon. This underscores the importance of utilizing SEO to rank high on search pages.
Amazon Product Sales Statistics
- Amazon has over 12 million product and service listings.
- Small and medium-sized businesses in the US sell an average of 4,000 products per minute on Amazon.
- Amazon Web Services (AWS) accounts for 13% of Amazon’s overall revenue. AWS is a cloud platform providing digital infrastructure as a service.
- Amazon sells over 1 million products in the handmade category, with 56% of third-party sellers making sales every month.
- Even if they are not in the most popular category, handmade goods show the highest revenue with an average profit margin of 32%. This indicates that buyers are willing to pay extra for products with a personal touch.
- According to Statista’s reports, seller services revenues are second after third-party sellers, followed by Amazon Web services and retail product sales.
- In 2020, third-party sellers made a net revenue of 80.5 billion dollars selling home, kitchen, and baby products.
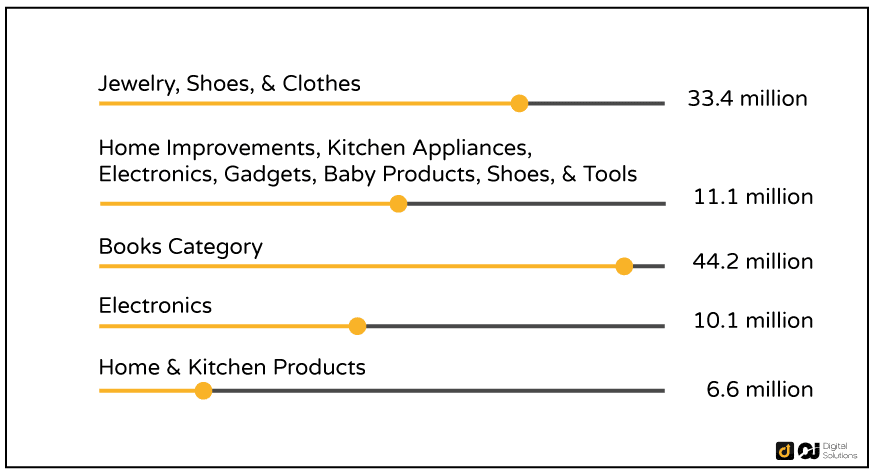
- According to Amazon statistics, 33.4 million of revenue comes from jewelry, shoes, and clothes.
- The Books category is the biggest category on Amazon and sells more than 44.2 million products.
- The Electronics and Home & Kitchen categories follow, with 10.1 million products and 6.6 million sales, respectively.
- During the 2021 Amazon Prime Day, Fire TV Stick 4K was the most commonly purchased Amazon device.
- Amazon has the lion’s share in electronics, accounting for 90% of the market share in this category.
- An Amazon Seller Report states that 92% of sellers in the Home & Kitchen category created their own private label products.
- 36% of shoppers prefer Amazon Fresh—Amazon’s grocery delivery service—over other stores.
- About 81% of Amazon Fresh users show loyalty and say they will likely use the service again.
- Amazon Fresh brought in a revenue of $4.72 billion in Q2 of 2022. This shows a growth rate of 2.8% from Q1 of the same year.
Amazon Prime Statistics
- Amazon Prime is currently available in 22 countries.
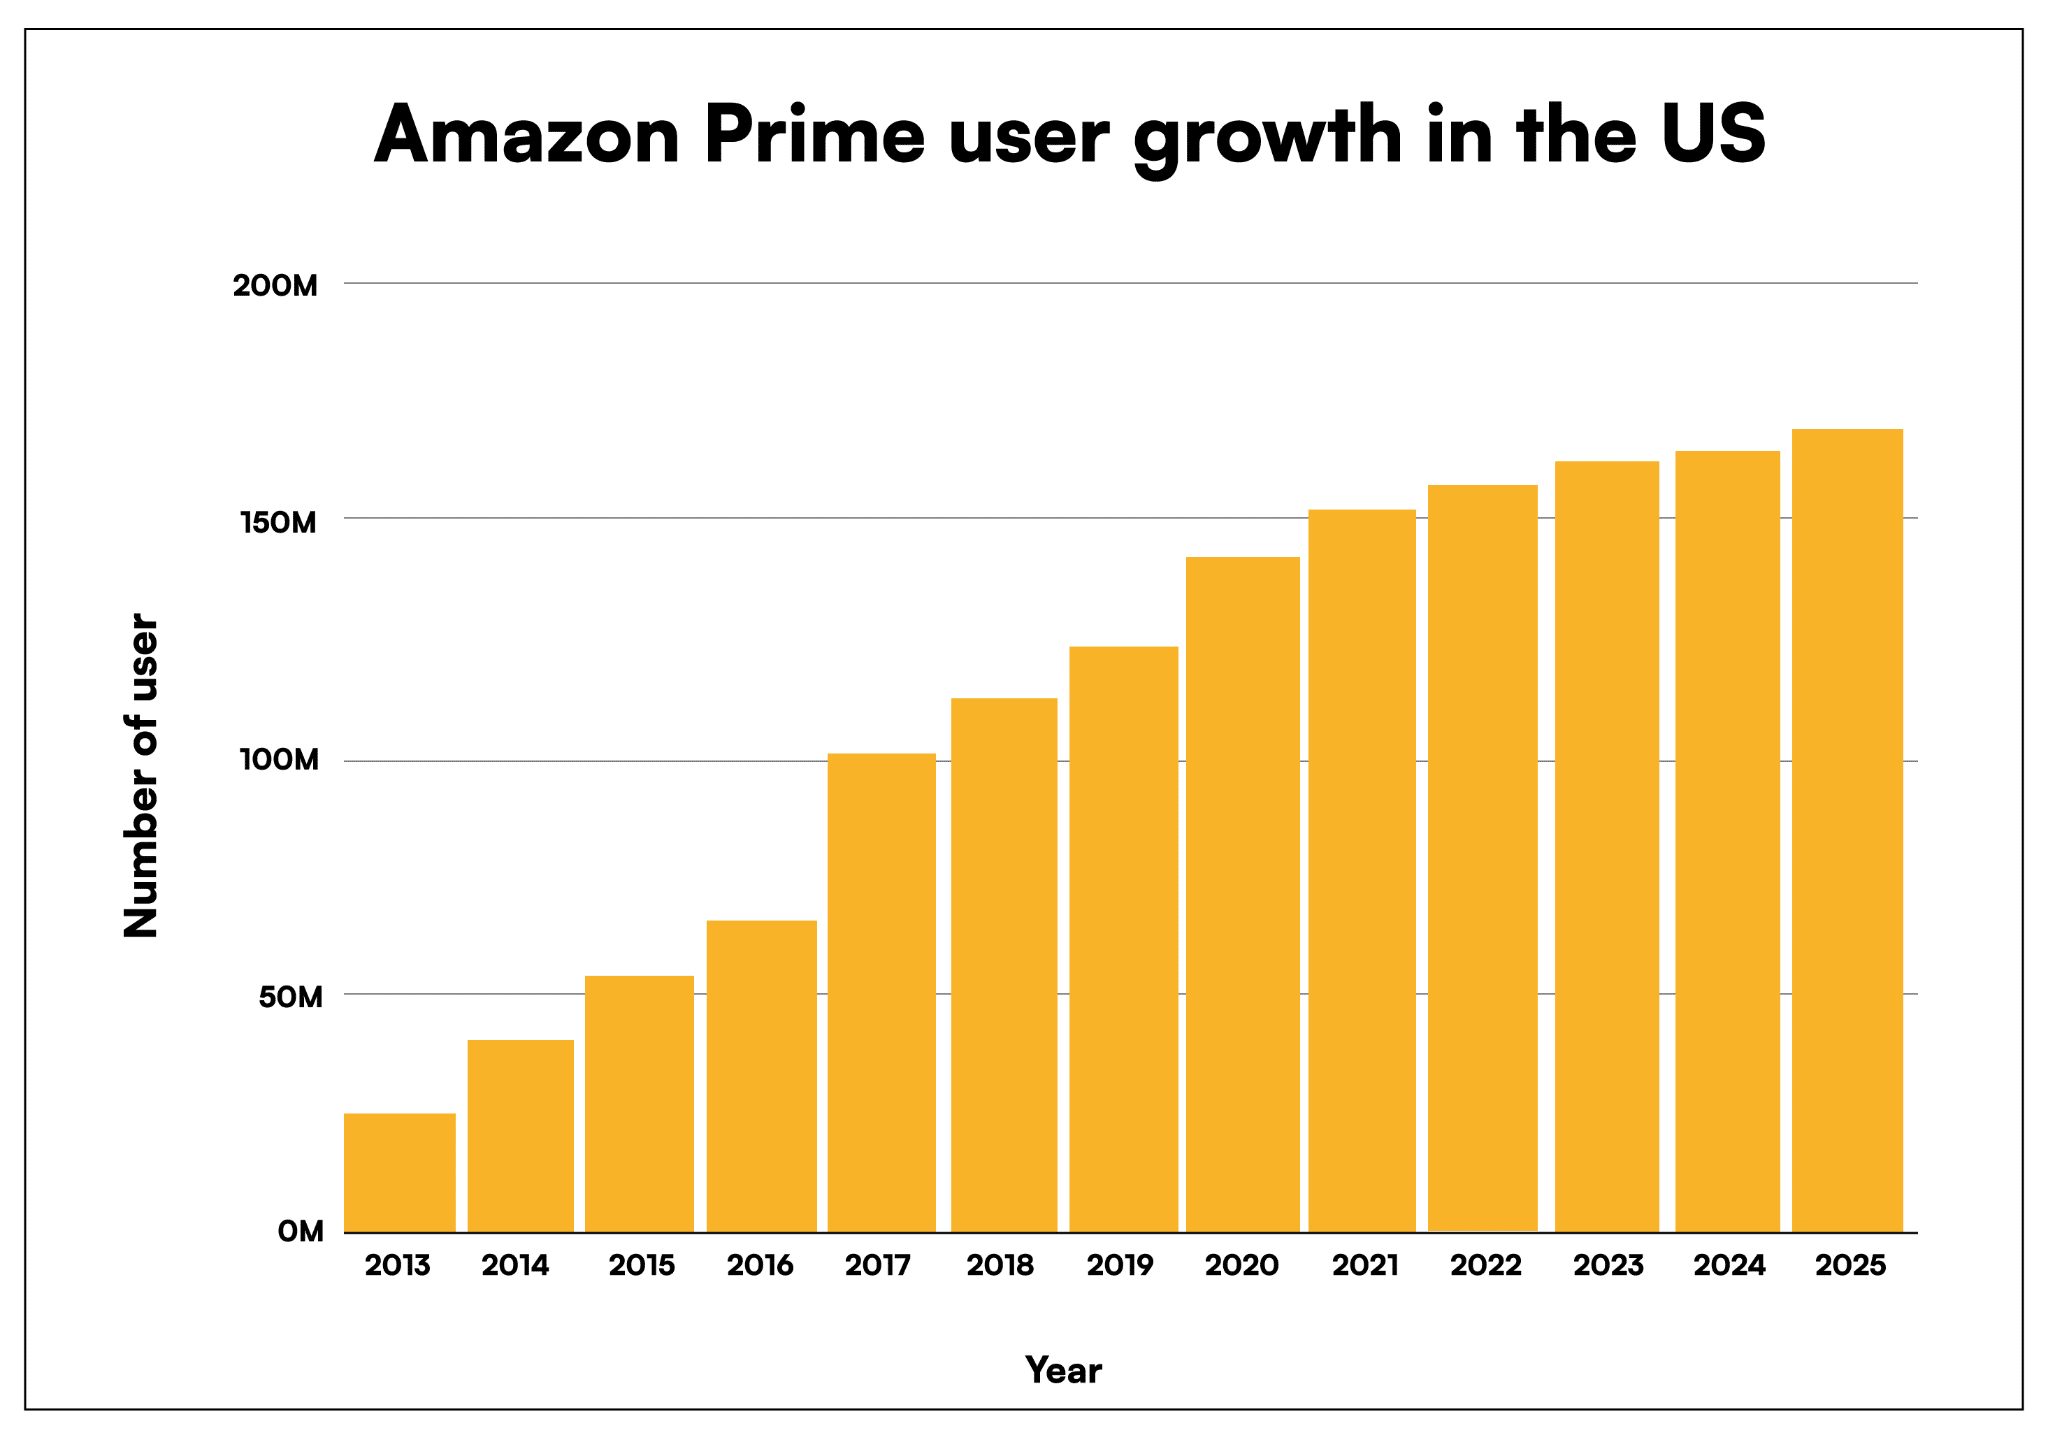
- Amazon has more than 200 million Prime subscribers around the world.
- There are 148.6 million Amazon Prime members in the US.
- eMarketer forecasts predict that the number of Prime users in the US will reach 157.4 million by 2022.
- Amazon registers $25.21 billion in annual revenue from retail subscription fees.
- During the 2020 holiday season, Amazon prime membership sold over 1.5 billion products.
- Prime Day sales continue to show upward growth through the years. Sales during Prime Day in 2021 climbed 4.64 times higher than Prime Day in 2017.
- 62% of total Prime Day Sales come from the US market. This amounts to a total of $7.31 billion in sales.
- On the 2021 Amazon Prime Day, Amazon Prime subscribers worldwide purchased more than 250 million items.
Amazon Brand and Product Discovery Statistics
- In 2021, Amazon sold over 13.5 billion items.
- The net profit totaled $407.4 billion.
- The website and app had more than 127.1 billion product views.
- Amazon’s average conversion rate was 9.7%.
- 59% of third-party sellers on Amazon create their own private label brands using Amazon’s private label model.
- Over 300,000 sellers use the free multi-page branded storefront to connect with more customers.
- 52% of shoppers are more likely to buy from unfamiliar brands in Amazon stores than on any other platform.
- Amazon Fresh registers 78% of brand awareness among online grocery delivery users in the US.
Amazon Brand Protection Statistics
- Amazon invested more than $700 million to protect its stores from abuse and fraud.
- In 2020, Amazon had over 10,000 employees to protect brands from abuse and fraud.

- Over 7000 small and medium-sized businesses used the Brand registry’s protection tools and connected to trusted law firms in the US and Europe to help them solve rising issues.
- In 2017, the Brand protection program blocked over 10 billion suspected bad listings, and 2 million counterfeit products were seized before shipment.
- In 2020, the Amazon verification process caught 6 million attempts to create fraudulent selling accounts before posting any product for sale.
- More than 15,000 brands were using Transparency, and 18,000 enrolled in Project Zero by the end of 2020.
- After all the safety measures went up, brands reported 0.01 attempts of infringement, while only 2% of customers reported counterfeit products.
COVID-19 Impact
- Small businesses and new third-party sellers enjoyed a 45% sales increase during the Covid 19 pandemic.
- In 2020, over 200,000 new online sellers listed their products on the Amazon marketplace.
- During the pandemic, Amazon invested over 5 billion to support its small business partners and ensure success and stability.
- Amazon invested $11.5 billion during Covid to shield its employees from the impacts of the pandemic. It also provided safety measures to protect them when handling and delivering products to customers.
- By the end of 2020, Amazon had pumped in more than $18 billion to support small and independent businesses in growing their sales on Amazon.
Frequently Asked Questions (FAQs)
How Much Does Amazon Sell a Day?
Amazon has an average of $1.29 billion in daily sales.
According to Statista’s reports, Amazon’s total revenue in 2021 was $469.8 billion.
As a net retail business, Amazon earned a net income of $33.36 billion in 2021 and $21.3 billion in 2020.
How Many Products Does Amazon Sell Per Day?
Amazon sells more than $1.6 million products per day.
The company ships out over 66,000 products per hour and 19 orders per second. The site attracts millions of unique visitors and Amazon Prime members who purchase an item within 15 minutes.
In 2019, Amazon marketplace sellers and retail stores sold over $385 million per day during the pandemic. Online shopping became the best alternative, and Amazon reaped huge profits.
What Are the Abandoned Shopping Cart Amazon Statistics?
On average, 69.57% of customers abandon carts when shopping online. This mainly occurs when the customer comes across a product they don’t need or have no budget for at the moment.
Once the product is moved to the cart and isn’t checked out immediately, there’s a big chance the customer may never complete the order.
What Are the Average Black Friday and Cyber Monday Amazon Statistics?
- In 2021, US shoppers spent $8.9 billion on Amazon during Black Friday.
- On Black Friday 2021, Amazon offered an average discount of 24% on most products.
- Over 154% million US shoppers participated in the Black Friday rush.
- On Amazon Prime Day, Amazon earned net revenue of $11.2 billion.
- Amazon sellers running Prime Day sales increased by 4,285% between the year 2015 to 2019.
The Bottom Line
These Amazon sales statistics show that Jeff Bezos’ retail giant is here to stay and that you can expect more growth in the future.
As online shopping becomes increasingly popular, sellers must be more proactive to stand out from their competitors and boost customer satisfaction.
Hopefully, this guide has shown you the information you need to know to formulate effective business strategies.
Ready to take your Amazon business to the next level? Why not begin by ensuring smooth operations?
Check out my guide on the best Amazon inventory management software to help you keep track of your inventory.




One Response
Good read 👍🏻
Comments are closed.