In the fiercely competitive retail arena, businesses must do their best to attract retail shoppers to boost their online sales or physical store sales.
That’s why you need to have the latest retail marketing statistics. Research on the various retail industry sectors can help you make better marketing strategies.
If you need to learn more about retail industry statistics, you’ve come to the right place.
This article tackles all the relevant information you need to know about retail sales, retail marketing, and the retail industry.
Let’s begin.
Definition of Retail Marketing Statistics
Retail marketing encompasses all the ways a consumer business tries to attract customers.
Retail marketing statistics are the interpretation of data from the retail sector, including retail sales, consumer behavior, physical locations, and more.
Global Retail Marketing Stats
These global retail shopping statistics talk about the effect of the pandemic on worldwide retail sales.
- COVID-19 affected global retail sales expectations. Previous studies showed that it would hit $27.73 trillion by 2020. However, because of the pandemic, estimations dropped to just $23.4 trillion.
- 2020 saw worldwide sales decline by 3% to $23.389 trillion.
- Studies initially estimated global retail sales to drop at a -1% compound annual growth rate (CAGR) in 2020.
- Global retail sales were then expected to recover in 2021 by 5.1% in CAGR.
- In 2021, the largest global eCommerce market was China. The country was responsible for 33% of the global retail market, with $792.5 million in sales.
- eCommerce online shopping accounted for 95% of retail sales.
- In 2021, there were 7.9 million eCommerce retail stores worldwide.
- Distribution centers and building supplies remain the most profitable retail sector. These sectors have a 5% net margin.
- In 2021, six out of ten retail industry executives expect the retail sector to recover in one to two years. A quarter expected the retail industry to recover in two to five years.
Source: Finances Online
US Retail Marketing Stats
American retail statistics in marketing focus on stats that are only true in the US. These retail statistics vary in other parts of the world.
- In 2019, the US retail industry had 442,597 brick-and-mortar retail stores.
- The US retail industry has 2.1 million eCommerce online shopping stores.
- In December 2020, total retail sales in the US had a $540.9 billion valuation.
- In 2021, the US retail industry had a 2.9% growth year-over-year.
- In 2020, retail sales showed a 0.6% growth compared to 2019.
- Online retail sales jumped to $374.34 million in 2020. This is a 9.1% growth compared to the $343.150 million in retail sales in 2019.
- In November 2020, the retail market hit its highest unemployment rate at 6.7%.
- In 2020, Amazon accounted for 39% of online shopping sales in the US.
- In 2020, around 125 consumer goods and retail stores filed for bankruptcy.
Source: Finances Online
Big and Small Retailer Stats
Big and small retail statistics talk about giants like Walmart and smaller brick-and-mortar stores. They cover both eCommerce sales and physical store sales.
- 52.8% of Americans visit Walmart in any given month.
- In 2020, Walmart retail stores had 265 weekly customer visits.
- In 2020, Walmart had 11,501 physical stores.
- In 2019, 98.6% of retail industry firms had 50 employees or less.
- Retail statistics show that small retailers are responsible for hiring 39.8% of all retail employees.
- In 2021, 88% of retail business executives agreed that digital acceleration is their top investment priority.
Source: Finances Online
Retail Marketers Spending Stats
This section discusses retail marketers’ spending, not online customers’ spending.
- In 2023, US retail brands plan to spend over $50 billion on digital ads. This is a 50% increase from 2020.
- In 2023, the consensus expects eCommerce online purchase spending to reach $36 billion.
- Retail industry statistics show that a retail lead costs an average of $34.
- Retail companies’ average lead conversion rate is 3%.
Source: Invoca
Retail Marketing Failure Stats
This section talks about the struggles of retail marketing when it comes to online consumers.
- 73% of US retail consumers shop through multiple retail businesses.
- 59% of retail shoppers use their mobile device in-store to compare prices with online shops.
- 35% of retail marketers say poor online shopping statistics prevent them from targeting consumers with the right ads.
- Single-channel retail store campaigns had a 5.4% average engagement rate. A retail store with three or more channels had an average engagement rate of 18.96%.
- 84% of online shoppers say the US retail market should do more integration online and offline.
Source: Invoca
Retail Marketing Calls Stats
This section discusses how calls affect the overall customer experience.
- 39% of mobile search consumers are likely to call the retail establishment.
- Online shoppers are most likely to call retail establishments for mean price points of $119.
- Paid search ads result in 37% of shoppers calling retail establishments.
- Calls influence $1 trillion worth of US retail sales annually.
- Phone calls are 10-15% more likely to convert to revenue than web leads.
- Calls have a 30% faster conversion rate than web leads.
- Caller retention is higher than web lead retention by 28%.
- 84% of marketers say calls have a higher conversion rate with larger volumes.
Source: Invoca
Retail Marketing Personalization Stats
This section talks about how many consumers prefer businesses that personalize and make an effort to connect.
- 80% of shoppers say the customer experience is as important as the products and services.
- 32% of shoppers rate calls as the “most frustrating” channel regarding customer service.
- 65% of shoppers cut ties with big or small retailers over poor customer service.
- 38% of shoppers stop doing business with big or small business owners over a bad call.
- 59% of shoppers say rude agents cause a bad call experience.
- 58% of shoppers say long hold times cause a bad call experience.
- 54% of shoppers say too many transfers cause a bad call experience.
- 46% of shoppers say repeating information causes a bad call experience.
- 75% of shoppers hang up within ten minutes of waiting on hold.
- 40% of shoppers expect higher personalization levels over the phone compared to other channels.
Source of section: Invoca
Retail Marketing Investment Stats
This section talks about the economics of retail marketing. It involves total global retail sales, projections, and opening-and-closing rates.
- In 2021, worldwide retail sales grew to $26 trillion.
- In 2021, US retail sales almost hit $6.6 trillion.
- Projections say total global retail will hit $31.3 trillion by 2025. They also show that global retail will grow by 4% to 5% yearly.
- When one store closes, two stores open.
Source: Fit Small Business
Social Media Retail Marketing Stats
This section discusses everything related to social media and retail marketing. It talks about social media statistics in general and specific statistics for the most popular platforms.
General Social Media Retail Marketing Stats
- Data shows that retail media will grow 5x in the next five years.
- Retail media will increase expenses by $48 billion from 2019 to 2024.
- Over 23,500 companies bought retail media ads on social networks. This ran from May 2021 to January 2022.
- In 2021, digital retail media advertising spent $77 billion worldwide.
- By 2024, digital retail media advertising spending expects to increase to $143 billion.
- Over half of the largest US eCommerce businesses have their own media networks.
- 74% of brands have a retail media advertising dedicated budget.
Source: Loyal Guru
Retail Media Ad Spends Through 2024
- In 2021, retail media networks spent $31 billion on US brands.
- By the end of 2022, US retail media ad spending will triple its pre-pandemic total and reach $40.81 billion.
- 24% of big and small businesses advertising in January 2022 were first-time buyers.
US Retail Media Ad Spending in the US From 2019 to 2024
| Billions | Ad Spending (%) | Change (%) | |
|---|---|---|---|
| 2019 | $13.23 | 10% | |
| 2020 | $20.81 | 13.6% | 57% |
| 2021 | $31.06 | 14.7% | 49% |
| 2022 | $40.81 | 16.4% | 31% |
| 2023 | $51.36 | 18.1% | 25% |
| 2024 | $61.15 | 19.1% | 19% |
US vs. Worldwide Retail Media Ad Spending From 2021 to 2024
| US (billions) | Worldwide (billions) | US vs. Worldwide | |
|---|---|---|---|
| 2021 | $31.06 | $77 | 40% |
| 2022 | $40.81 | $95 | 43% |
| 2023 | $51.36 | $116 | 44% |
| 2024 | $61.15 | $143 | 43% |
Source: Loyal Guru
TikTok Retail Marketing Stats
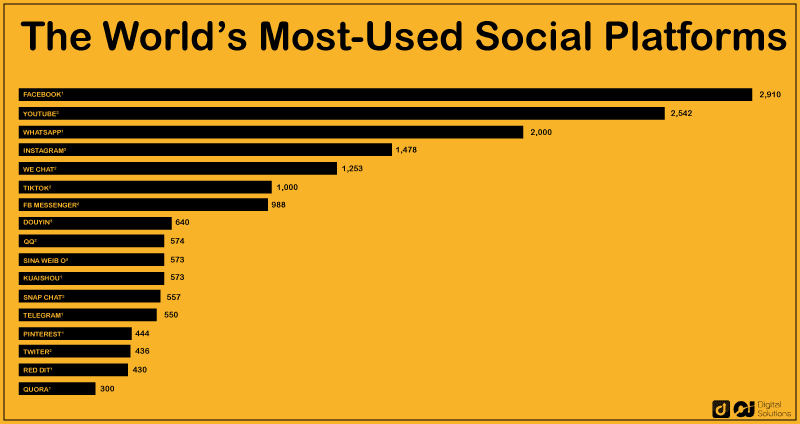
- TikTok has one billion worldwide users.
- 43% of TikTok users are 18 to 24 years old.
- 57% of TikTok users are female.
- Most TikTok users, 226.8 million of them, come from Southeast Asia.
- TikTok has over 3.5 billion downloads.
- TikTok ranks sixth in the list of most popular social media networks.
- US users spend a daily average of 38 minutes on TikTok.
- In 2022, the number of TikTok-using brands will likely grow by 40%.
- In 2022, TikTok ad revenue expects to hit $12 billion.
- TikTok has 50,000 influencers.
- In 2021, 45% of brands took their influencer marketing campaigns to TikTok.
Source: Shopify
Instagram Retail Marketing Stats
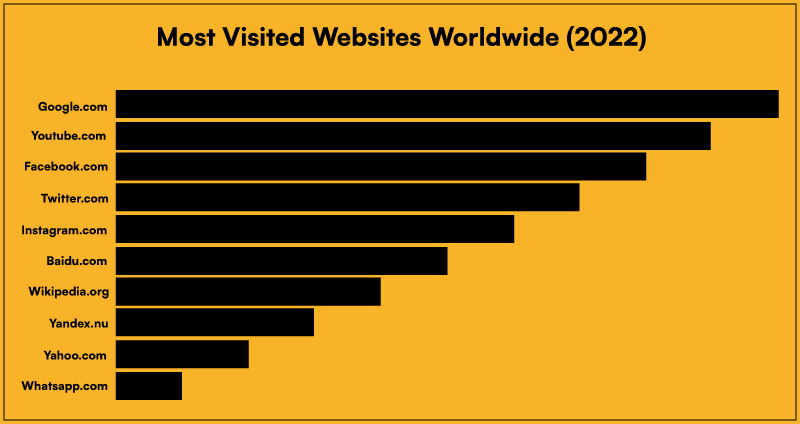
- Instagram is the seventh most-viewed website globally, with 2.9 billion monthly visits.
- Instagram is the ninth most-searched term on Google.
- Instagram is the fourth largest social media platform, with 1.5 billion daily active global users.
- 0.1% of Instagram users only use Instagram.
- 83% of Instagram users also use Facebook.
- 55% of Instagram users also use Twitter.
- 1.22 billion people use Instagram monthly.
- 60% of Instagram users are 18 to 34 years old.
- India has the most Instagram users, at 201 million.
- The US has the second-highest number of Instagram users, at 157 million.
- 59% of US adults use Instagram every day.
- Around 90% of users watch Instagram videos every week.
- 58% of Instagram users say they become more interested in a brand after seeing it in a Story.
- Brand Stories on Instagram have a 86% completion rate.
- Sports account Stories have a 90% completion rate, the highest recorded.
- 90% of Instagram users follow at least one business.
- The average business account grows by 1.69% every month.
Source: Hootsuite
Facebook Retail Marketing Stats
- The number of monthly active users on Facebook is now 2.91 billion, a 6.2% increase from 2.74 billion in 2021.
- 36.8% of the world’s population uses Facebook every month. Facebook has 2.91 billion users, while the Earth’s population is only 7.9 billion as of November 2021.
- Only 4.6 billion of the world’s population have access to the internet. 58.8% of this number use Facebook.
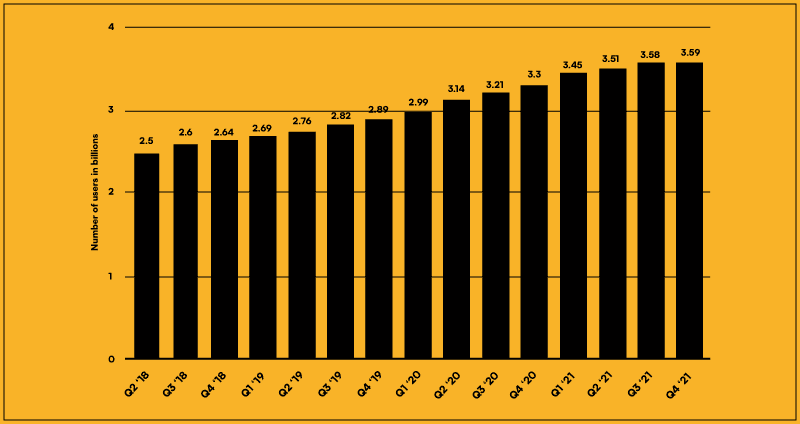
- 77% of internet users—about 3.59 billion—are active on at least one Meta platform.
- Over 72% of Facebook users also use other platforms like YouTube, Instagram, and WhatsApp.
- Facebook is the favorite social platform of people 35 to 44 years old.
- 69% of Americans use Facebook.
- Users spend an average of 19.6 hours each month on Facebook.
- Facebook is the source of news for 31% of Americans.
- 81.8% of Facebook users access social media through their mobile devices.
- 1.8 billion users use Facebook Groups monthly.
- 53% of users are likely to purchase from a business with live chat.
- Facebook can translate hundreds of languages in real time.
- Facebook has a 5.2% average organic reach for a Facebook Page post.
- US ad spending on Facebook surged 15.5% year-over-year in 2022.
- Facebook ads can reach 34.1% of the global population over 13 years old.
- Facebook ads can reach 63.7% of Americans over 13 years old.
- 50% of consumers use Facebook Stories to discover new products.
- There are one billion monthly active users on Facebook Marketplace.
- The number of worldwide Facebook Shops equals 250 million.
- Facebook Marketplace ads can reach 562 million users.
- 150 countries now have Facebook Reels.
- Facebook beat short-form videos on TikTok with 60.8% of user shares.
- Facebook has a 42.6% live video user share.
Source: Hootsuite
YouTube Retail Marketing Stats
- YouTube has more than 2 billion monthly active users.
- US YouTube users equate to 15.6% of total worldwide users.
- 77% of YouTube users are 15 to 35 years old.
- 70% of users bought a product after seeing it in a YouTube ad.
- The top YouTube ad in 2021 was the Hyundai and BTS collaboration.
- YouTube is the world’s second most-visited website.
- 58% of the top YouTube searches are music-related.
- Google bought YouTube in 2006 for $1.65 billion.
- YouTube ads started in August 2007.
- YouTube is available in over 100 countries in 80 languages.
- 71% of marketers plan to increase their YouTube marketing efforts.
- 50% of marketers are already using YouTube.
- 22% of marketers use YouTube stories.
- 14% of marketers use YouTube Live.
- YouTube is second to Instagram when it comes to influencer marketing.
Source: SproutSocial
Reddit Retail Marketing Stats
- Reddit has more than 430 million active monthly users.
- Reddit is the fifth most-visited website in the US.
- 63.8% of Reddit users are male.
- 47.13% of Reddit users are in the US.
- Reddit has 52 million daily users.
- Reddit users spend a daily average of 24 minutes on the platform.
Source: Hubspot
Pinterest Retail Marketing Stats
- Pinterest is the 14th largest social network.
- Pinterest has 431 million active monthly users.
- Monthly Pinterest users in the US shrank by 12% in 2021.
- Pinterest users are 60% women.
- Pinterest’s ad audience is 29.1% women, 25 to 34 years old.
- 86.2% of Pinterest users also use Instagram.
- 82.7% of Pinterest users also use Facebook.
- 79.8% of Pinterest users also use YouTube.
- 82% of Pinterest users access the social network on their mobile devices.
- Almost one billion videos are being viewed on Pinterest daily.
- Unbranded results make up 97% of Pinterest’s top searches.
- 85% of Pinterest users use the platform to plan new projects.
- 80% of Pinterest users say the platform makes them feel positive.
- Advertisers have potentially over 200 million Pinterest users to reach.
- In 2021, shopping engagement saw a 20% growth.
- 75% of weekly Pinterest users say they always shop.
- 40% of weekly Pinterest users say they love shopping.
- Pinterest posts that use “new” in overlay text have a 900% higher aided awareness.
Source: Hootsuite
Twitter Retail Marketing Stats
- YouTube is the most popular Twitter brand account.
- Twitter.com ranks ninth among the most-visited websites worldwide.
- Twitter users consist of a quarter of US adults.
- 30% of Twitter users are women, while 70% are men.
- 42% of Twitter users have a college education.
- 85% of Twitter users have an income of over $30,000.
- 34% of Twitter users have an income of $75,000 and above.
- The average Twitter user spends 5.1 hours monthly on the platform.
- 54% of Twitter users are likely to purchase new products.
- 26% of Twitter users spend more time looking at ads than on other platforms.
- The average Twitter user spends 6 minutes daily on the platform.
- There are over 500 million daily Tweets.
- 70% of Twitter users regularly watch, follow, or have an interest in soccer.
Source: Hootsuite
Snapchat Retail Marketing Stats
- Snapchat’s daily active users are 319 million.
- The “Snapchat ads” keyword increased +49.5% year-over-year.
- The “Snapchat ads manager” keyword increased by +241% year-over-year.
- The “Snapchat business” keyword increased by +174% year-over-year.
- The “Snapchat business manager” keyword increased by +120% year-over-year.
- 92 million Snapchat users, the largest group, are from North America.
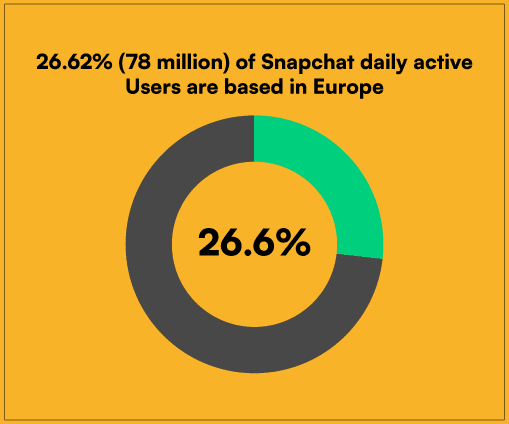
- The second largest Snapchat user group is in Europe, with 78 million users.
- About 90% of Snapchat users are also Instagram users.
- 63% of daily active users on Snapchat use AR filters.
- Snapchat users have a total spending power of $4.4 trillion.
- Global advertising revenue on Snapchat is more than $2.5 billion.
- Ads with sounds are 64% more successful.
- 54.4% of Snapchat’s advertising audience is female.
Source: Hootsuite
LinkedIn Retail Marketing Stats
- Over 12 million LinkedIn members use the #OpenToWork photo frame.
- LinkedIn has 810 million users.
- 57% of LinkedIn users identify as men.
- 43% of LinkedIn users identify as women.
- 23% of LinkedIn users are in the US.
- Almost 60% of LinkedIn users are 25 to 34 years old.
- Google is the most-followed organization on LinkedIn, with 23.38 million followers.
- Bill Gates is the most-followed person on LinkedIn, with 35 million followers.
- 49 million people use LinkedIn weekly to search for jobs.
- Every minute, 6 people from LinkedIn get hired.
- 16.2% of US LinkedIn users log in daily.
- 48.5% of LinkedIn users in the US use the platform at least once a month.
- Employees are 14x more likely to share employer content on LinkedIn than on other platforms.
- Posts with images get 2x higher engagement on LinkedIn.
- LinkedIn ads can reach 14.6% of the world’s population.
- LinkedIn’s ad reach increased by 2.8% in Q4 to 22 million users.
- Brands see a 33% increase in purchase intent from LinkedIn ad exposure.
- Marketers experience up to 2x higher conversion rates on LinkedIn.
- 40% of B2B marketers said LinkedIn was the most effective to drive high-quality leads.
- 93% of B2B marketers use the platform for organic social marketing.
- 77% of marketers say the best organic results come from LinkedIn.
- 75% of B2B marketers launch ads on LinkedIn.
- LinkedIn Live gives brands 7x more reactions and 24x more comments compared to regular videos.
- Companies posting weekly on LinkedIn see their engagement rate rise to 2x.
Source: Hootsuite
Online Retail Marketing Stats
This section covers information about the largest online retailers in the world.
Amazon Retail Marketing Stats
- In 2021, Amazon made $15,100 per second or $469.8 billion for the whole year.
- Amazon had 5.6 billion visits in the US in the first quarter of 2022 alone.
- The bounce rate of Amazon is only 22%. Bounce rate is the rate of visitors opening one page before leaving.
- 66.6% of Amazon web traffic comes from the desktop.
- 33.4% of Amazon web traffic comes from mobile.
- Amazon sells 4,000 items per minute.
- Amazon has over 300 million active monthly users.
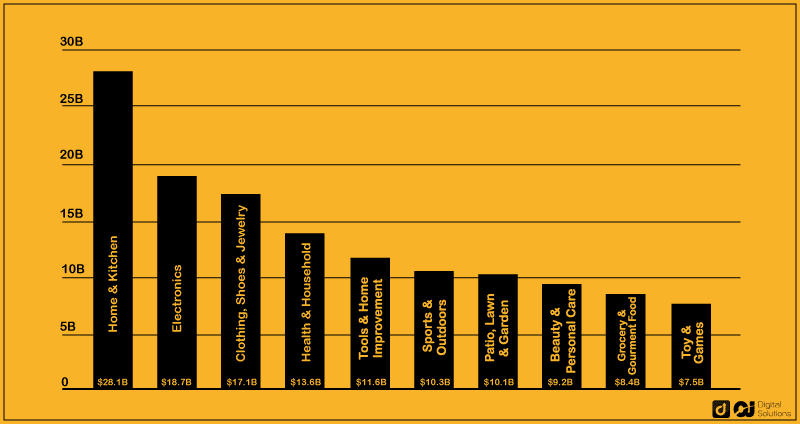
- The most profitable category on Amazon is Home & Kitchen at $28.1 billion.
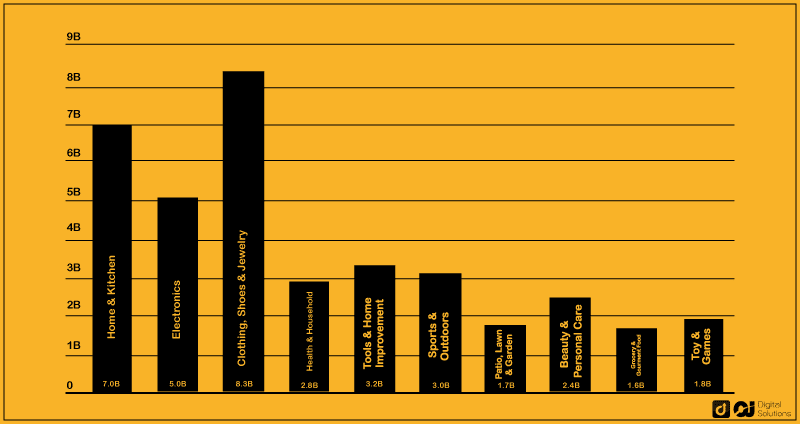
- The highest number of units sold on Amazon is in the Grocery & Gourmet Food section, with 742.6 million units.
- 60% of Amazon users are female.
- 40% of Amazon users are male.
- 70.2% of Amazon visitors have a college degree or higher.
- 81% of Amazon users are fully employed.
- Only 3.4% of Amazon users are not working.
- Amazon is the #3 app in the Google Play US shopping category.
- Amazon is the #2 app in the Apple Store US shopping category.
- 57.2% of US Android users installed Amazon on their devices.
Source: Similar Web
Etsy Retail Marketing Stats
- In 2021, Etsy had 96.3 million active buyers.
- 81% of purchases come from repeat buyers.
- In Q4 2021, Etsy acquired 10 million new buyers.
- The Etsy app has over 80 million downloads.
- In 2021, habitual buyers on Etsy grew 26% year-over-year.
- 76% of sellers on Etsy consider their online store a business.
- 86% of sellers on Etsy are female.
- In June 2022, Etsy had 377.5 million average visits.
- In June 2022, Etsy had a 45.78% bounce rate.
- 58.79% of Etsy users are from the US.
- Etsy has at least 2.1 million sellers with around 40 million buyers.
- 45% of Etsy sellers were only successful once they started selling on the platform.
- 76% of Etsy sellers consider their online stores a business.
- 30% of Etsy sellers focus completely on their creative business.
- 46% of Etsy sellers applied for a business tax ID.
- 41% of Etsy sellers opened a bank account.
- Top Etsy seller PlannerKAte1 has made over 1.8 million sales since opening.
- Etsy grew 91% in the first half of 2020.
- Etsy advised sellers to sell face masks resulting in $346 million worth of mask sales among 110,000 sellers.
Source: Influencer Marketing Hub
eBay Retail Marketing Stats
- eBay has around 1.6 billion live listings.
- eBay’s most expensive sale is a $168 million Giga yacht.
- In Q1 of 2022, $11.9 billion of gross merchandise on eBay came from mobile devices.
- Electronics and accessories are the most popular eBay category at 16.4%.
- 53% of the company’s gross merchandise value involves mobile device interaction.
- 80% of eBay sales are brand-new items.
- In Q1 of 2022, eBay had 142 million active users.
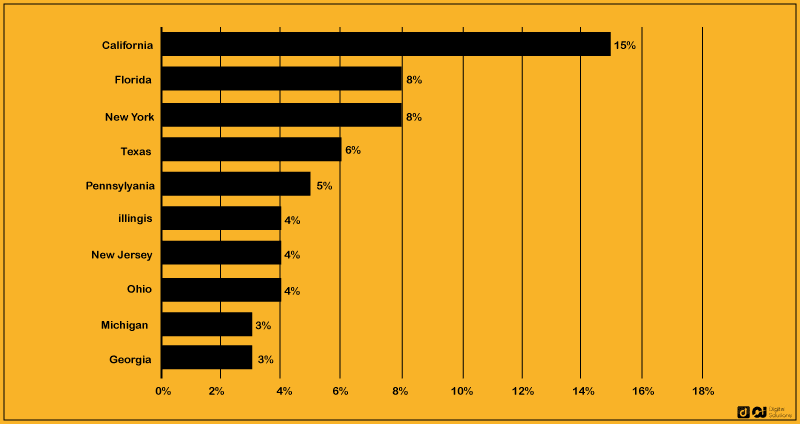
- 31% of eBay sellers are from the US.
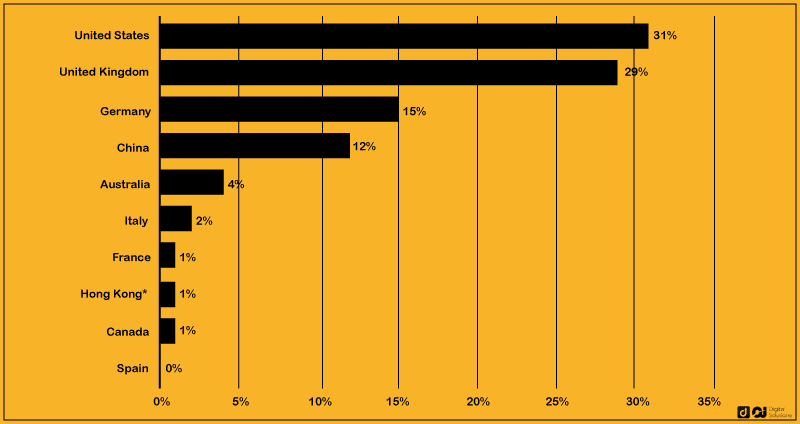
- 15% of eBay sellers are from California.
Source: Startup Bonsai
The Bottom Line
Whether your store is an ecommerce or brick-and-mortar store, you need to know how to catch customers’ attention to drive sales.
Thus, your marketing strategies should draw on accurate retail statistics.
Hopefully, this guide has shown you what you need to know to formulate effective marketing strategies.
If you want more information about online shopping, consumer behavior, and retail trends, check out our guide on online shopping statistics.

