Why does the US Small Business Administration allot massive resources to small businesses?
If you’re unsure why small businesses are essential, you’ve come to the right place.
I wrote this article to provide several interesting small business statistics. I’ll also detail why the US Small Business Administration supports entrepreneurs and small businesses.
Let’s begin.
What Classifies as a Small Business?
The US Small Business Administration defines a small business as having no more than 1,500 employees. The definition includes having a maximum of $41.5 million in average annual receipts.
A common misconception is that a small business is just small business owners and one or two employees. However, it could also be corporations with multiple small business owners and hundreds of workers.
The US Small Business Administration considers companies as small businesses if they pass specific requirements:
- Must have at least 100 employees (including the small business owners)
- Revenue of at least $1 million
Outside of the US Small Business Administration, the public follows other standards for small businesses.
Small businesses can also be companies with less than 100 employees (including the owners).
Meanwhile, medium-sized businesses had 100 to 999 employees (including the owners).
You can categorize small and midsize businesses under the “small and midsize business” (SMB) category.
Different Small-Business Industries
A critical aspect of small business statistics is the size of each industry.
For entrepreneurs who are just starting, knowing how many small businesses are in each industry can help them make better decisions.
Here are the top five small business industries:
- Retail – 15.05% of small businesses
- Food and restaurant businesses – 13.71% of small businesses
- Business services – 10.10% of small businesses
- Health, beauty, and fitness – 9.71% of small businesses
- Residential and commercial services – 9.33% of small businesses
The other 14 categories each made less than 6% of small businesses.
The info below is from Guidant Financial’s 2022 Business Trends Survey.
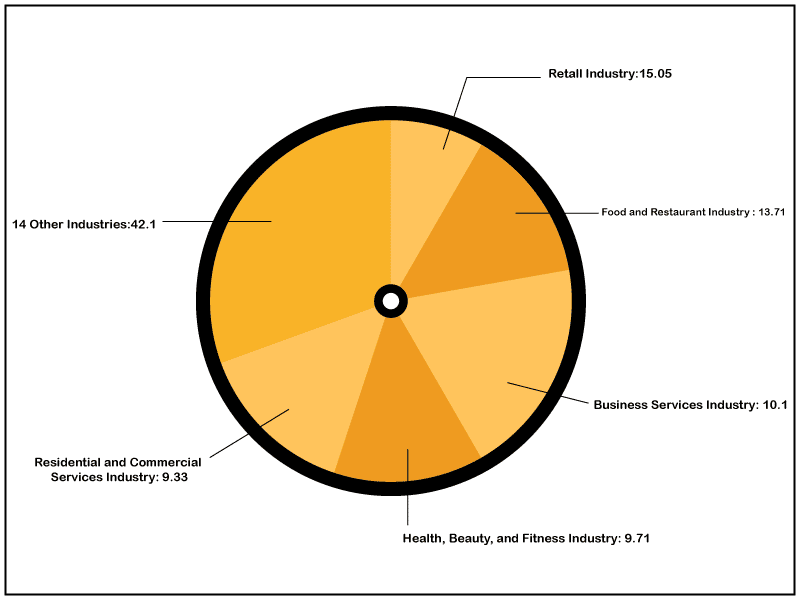
Statistics show most small businesses come from the food and restaurant industry.
Small Business Owner Statistics and Demographics
The survey also examined US small business owners’ gender, age, and other crucial metrics.
Small Business Statistics by Owner’s Gender
- 77.5% of owners classify themselves as male.
- 23.4% of owners classify themselves as female.
- 0.2% of owners self-describe themselves for their gender.
There’s been an increase in women-owned businesses in the US.
According to a survey by Gusto, women started 49% of new businesses in 2021—up from 28% in 2019.
Small Business Statistics Based on Owner’s Age
- 46.5% of owners are Gen X (born between 1965 and 1984)
- 45.5% of owners are Baby Boomers (born between 1946 and 1964)
- 7% of owners are Millennials (born between 1981 and 1996)
- 0.5% of owners are Gen Z (born between 1997 to 2012)
- 0.5% of owners are Post War (born before Baby Boomers)
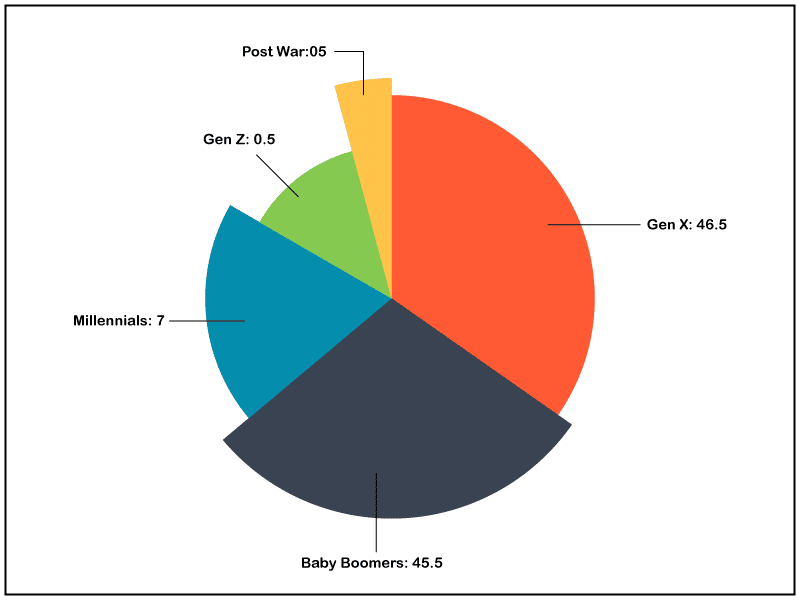
Most business owners are 38 to 57.
The next largest group comes from adults aged 57 to 76.
The younger generation, aged 10 to 25, comprised the smallest chunk of small businesses.
Zippia did another survey showing slightly different results.
- 7% of owners were 20 to 30 years old.
- 30% of owners were 30 to 40 years old.
- 63% of owners were over 40 years old.
Small Business Statistics Based on Owner’s Education
When surveying owners of small businesses, the study found that the majority of them had a bachelor’s degree.
The small business statistics showed that over half had a degree. Less than half were high school graduates, master’s graduates, and people with associate degrees.
- 9% of owners had a Master’s degree.
- 10% of owners had a High School degree.
- 21% of owners had an Associate degree.
- 52% of owners had a Bachelor’s degree.
While you don’t need a Bachelor’s degree to start a small business, most entrepreneurs still have it.
Small business statistics indicate only 10% of owners had just high school degrees.
Small Business Statistics: The Reasons for Starting a Business
There are many reasons people start a business.
Small business statistics show that most people were dissatisfied with corporate life, so they created a business.
Many people also started businesses because they wanted to pursue their passion.
Here are the most common reasons Americans started a business.
- 14.4% were for unknown reasons
- 21.4% were due to opportunities showing up
- 22.7% were because the owner wasn’t ready to retire
- 23.4% were because the owner got laid off or had their job outsourced
- 31% were because the owner wanted to pursue their passion
- 60.9% were because the owner felt dissatisfied with corporate America
Hard-working Americans created more than a million small businesses because private-sector employers didn’t make them happy.
Small Business Statistics on Finances
Knowing how businesses function financially is also essential.
According to a 2022 report, self-employed individuals had a median annual income of $55,858.
The report also found that 63% of small businesses were profitable—down from the 78% profitability rate in 2019.
The drop in profitability was primarily due to COVID-19. 23% of small businesses incurred losses, while 11% had to shut down temporarily.
A survey by Biz2Credit shows the difference in average annual revenue (AAR) between women-led and men-led businesses.
- Men-led small businesses earned an AAR of $675,643.
- Women-led small businesses earned an AAR of $475,707.
Regarding raising startup capital, 78% of small startups used their own money.
Different Types of Small Businesses
Here are the seven different types of small businesses.
Sole Proprietorship
This structure consists of small business owners who often handle all business responsibilities.
However, a sole proprietorship can still employ people, and some have at least one employee.
Sole proprietors’ personal assets are the same as their business assets.
An example of a sole proprietorship is a self-employed plumber offering plumbing services. The plumber does the plumbing, handles taxes, performs administrative tasks, and promotes the small business.
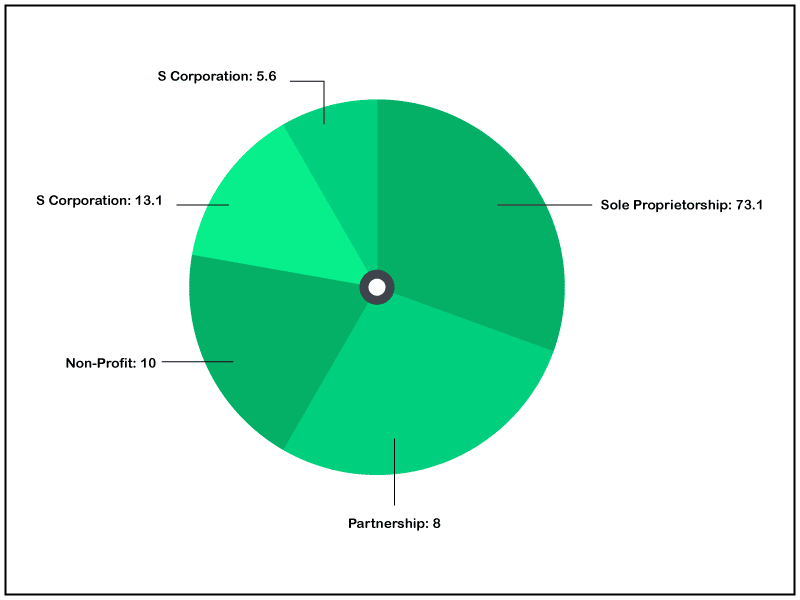
According to the Tax Foundation’s Census Bureau data overview, 73.1% of all businesses were sole proprietorships.
General Partnership
General partnerships involve two or more small business owners who are legally and financially liable for the business.
In a general partnership, the default rule is that owners (or partners) share equal equity. However, the split doesn’t have to be 50-50. Some partners can take more than half the equity.
Sole proprietorships have their perks, but so do general partnerships.
One partner could be in charge of manufacturing, while the other could handle promotion and marketing.
A general partnership is sometimes more strategic than a sole proprietorship when starting your own business.
Zippia finds that 62.3% of partners are men, 37.7% are women, and 9% are LGBTQ. The average age of an employed partner is 38.
67% of partners are likelier to work in private companies than public ones.
Limited Partnership (LP)
A limited and general partnership are similar. However, limited partners have little (hence the term “limited”) to no involvement in business management under a limited partnership.
A business can fail if there are too many people running it.
Small businesses rely on firmness and clear direction to succeed. They must maximize the capital they have to get the highest profit margins.
Small businesses survive better with a clear vision, direction, and consistency. A limited partnership specifies how much deciding power a partner has.
Sometimes investors own nearly half of the business.
An alternative to a limited partnership is to get an average small business loan.
According to Federal Reserve data, the average small business loan amount is $663,000.
According to the Tax Foundation’s Census Bureau data overview, 8% of all businesses in the US were partnerships. However, the data did not specify whether these were general or limited partnerships.
Limited Liability Company (LLC)
An LLC protects the owner from personal responsibility for the losses or debts of the business. It prevents the owner from experiencing personal financial harm should the business fail.
Small companies can also apply for an LLC as long they meet state requirements. States have varying laws regarding limited liability companies.
It can be hard when small business owners take all the risks. An LLC allows a company to make small business loans in the company’s name rather than the owner’s.
Non-Profit
A non-profit small business generates just enough profit to fund its operations.
The average small business employee for small non-profit companies can earn around $26K to $190K. The salary of the business owner might be different.
For non-profit small business firms, the owner often makes money, usually in the form of a salary.
A non-profit is usually a business helping local communities.
These small businesses rely on either donations or cash flow.
Without cash flow, the non-profit small business’s success relies on donors.
According to Zippia, non-profit small businesses are responsible for 10% of the US workforce.
5.6% of the GDP of the United States comes from non-profits.
Non-profit small businesses make up $2.62 trillion in total annual revenue.
C Corporation
Small businesses that are C Corporations tax their business owners separately from the entity.
Owners of a C Corporation only pay taxes when the business needs to pay taxes.
The small business entity is liable for corporate taxes, while its owners are liable for personal taxes.
5.6% of all businesses in the US are C Corporations, according to Census Bureau data.
S Corporation
An S corporation provides small business owners with limited liability protection regardless of the businesses’ tax status.
S Corporations have a special tax status with the IRS, giving them specific tax advantages.
Limited liability protection safeguards the owners’ personal assets from the business creditors’ claims.
With an S Corporation, business owners won’t have to pay self-employment taxes aside from Medicare and Social Security.
13.1% of all businesses in the US are S Corporations, according to Census data.
Small Businesses and Their Likelihood of Success
Creating small businesses is challenging.
Less than half of small businesses last more than five years.
Here are the statistics on the length of time small businesses remain operational.
- 7.2% of small businesses have yet to open.
- 51% of small businesses have existed for 0 to 5 years.
- 22.7% of small businesses have existed for 6 to 10 years.
- 10.96% of small businesses have existed for 11 to 15 years.
- 4.7% of small businesses have existed for over 20 years.
Many reasons affect a business’s tenure, including adjusting to an online business model.
Over the last few years, there’s been an increase in purely digital businesses. Many modern companies leverage the internet and technology to cater to their markets.
Some businesses create apps, games, APIs, and AIs or sell code. These are examples of purely digital companies that have gained popularity.
Many prominent businesses franchise their business strategy and models for new owners to combat the low survival rate of startups.
Another reason there has been an increase in new businesses is the popularity of freelancers, who are often sole proprietors.
MBO Partners estimates freelance work will grow by 25% in 2021 to 3.4 million.
Meanwhile, We Work found that the number of freelancers with a bachelor’s degree was less than that of small business owners.
While 52% of small business owners had bachelor’s degrees, only 35% of freelancers had bachelor’s degrees.
51% of freelancers had a post-graduate degree, while 35% had a college or associate degree.
Small business statistics show that a business’s success rate diminishes over time.
- 21.9% fail within their 1st year.
- 31.8% fail within their 2nd year.
- 39.7% fail within their 3rd year.
- 45.7% fail within their 4th year.
- 50% fail within their 5th year
- 53.6% fail within their 6th year.
- 57.7% fail within their 7th year.
- 61% fail within their 8th year.
- 63.2% fail within their 9th year.
- 65.7% fail within their 10th year.
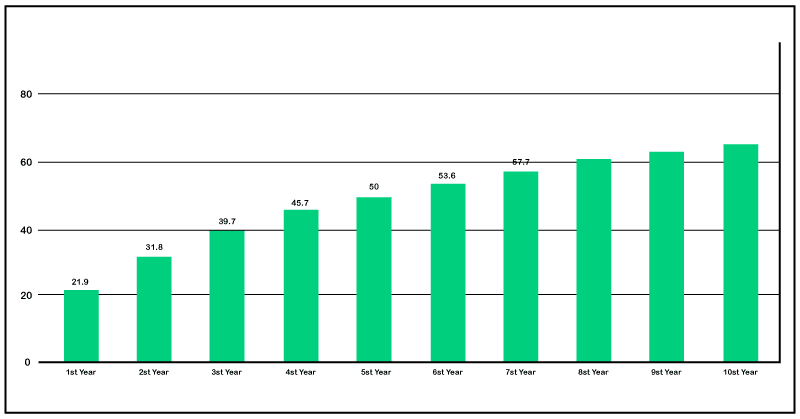
Here are more statistics on the percentage of small business success..
- 80% of small businesses will succeed within their first year.
- 55% of small businesses will succeed within their first five years.
- 25% of small businesses will succeed within their first 15 years.
The longer a business operates, the higher its chances of failure and the lower its chances of success.
COVID-19’s Effect on Small Businesses
Here’s how the COVID-19 pandemic affected small businesses.
- 23% lost revenue.
- 11% reduced their budget
- 11% had to close temporarily.
- 10% had to reduce personal wages.
- 7% had to temporarily pivot.
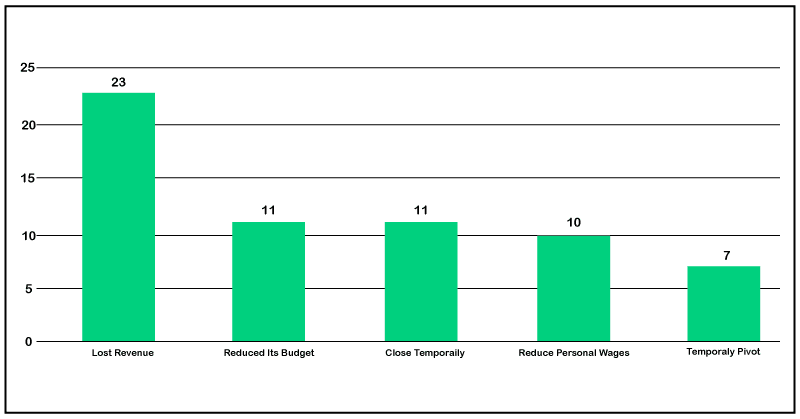
44.9% of businesses had negative experiences due to the pandemic. 6.9% reported a moderately positive effect, while 1.8% reported significant positive effects.
Owners and Their Thoughts on the Pandemic
The latest small business statistics show a positive outlook despite the pandemic. Almost 20% of small businesses reported a positive outlook for the future.
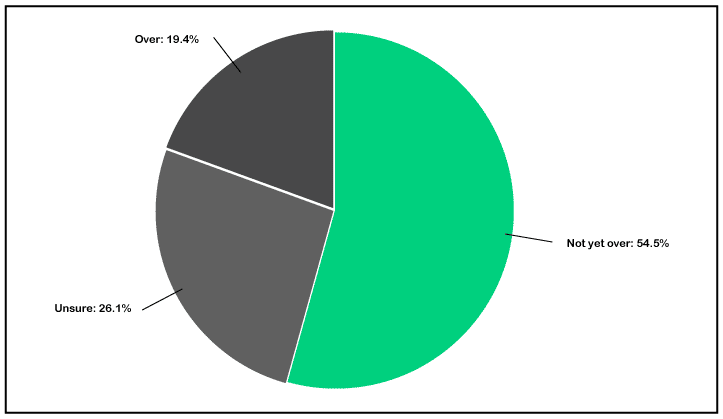
Here’s what small enterprises think about the effect of the pandemic.
- 54.6% of small businesses said the pandemic’s impact is not yet over.
- 26.1% of small businesses said they were unsure.
- 19.4% of small businesses said they felt the pandemic’s impact on their business was over.
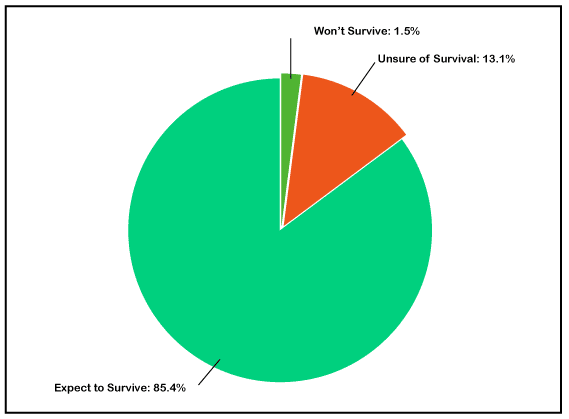
When asked if their businesses survive, many owners said yes.
- 1.5% expect their business not to survive.
- 13.1% said they were unsure if they could survive.
- 85.4% expect their small businesses to succeed through the pandemic.
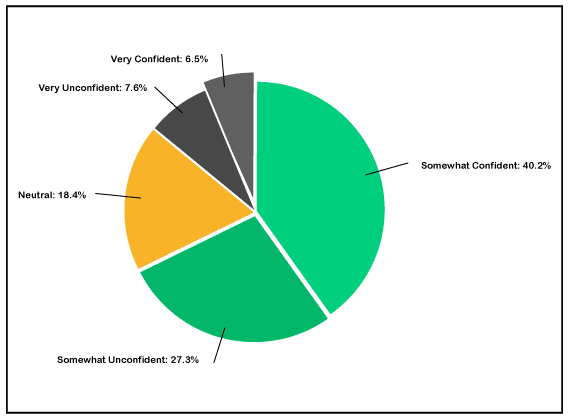
Here’s how confident owners are about their businesses as the pandemic matures.
- 6.5% said they were very confident.
- 40.2% said they were somewhat confident.
- 18.4% said they were neutral.
- 27.3% said they were somewhat unsure.
- 7.6% said they were very doubtful.
Small Business Facts on Failure
Businesses fail all the time due to different reasons.
A common misconception is that businesses fail because they get out-competed. The truth is only 20% fail because of the competition.
According to CBS Insights, most businesses fail because they run out of capital and cannot raise more.
Starting a business can be risky. Since most owners start a business with their capital, they need to find a way to inject more money into their business after a while.
Here are the common reasons small businesses fail.
- 5% failed because of burnout.
- 6% failed because they couldn’t pivot or change.
- 7% failed because of internal issues among the team or investors.
- 8% failed because of a poor product.
- 10% failed because of wrong product launch timing.
- 14% failed because they didn’t have the right team.
- 15% failed because of pricing or cost issues.
- 18% failed because of regulatory or legal challenges.
- 19% failed because of a flawed business model.
- 20% failed because they lost to the competition.
- 35% failed because they had no market.
- 38% failed because they ran out of capital and couldn’t raise more.
New entrepreneurs can learn from these statistics and avoid making the same mistakes.
Businesses that survived didn’t have zero problems along the way. They made it because they surpassed those problems.
What are Small Businesses Doing in Response to Retention and Recruitment?
Businesses face the challenge of retaining and recruiting employees.
Labor statistics show 63.17% of business owners have reacted by increasing employee compensation.
33% said they were making great efforts to retain the employees they already had.
Here are the strategies of other businesses.
- 22.93% decided to expand recruitment advertising efforts.
- 17.80% increased their benefits.
- 16.34% handed out hiring bonuses.
Employers have placed a significant increase on communication being an essential skill when hiring. Businesses also specified that teamwork, sales, adaptability, and critical thinking were crucial.
Here are the essential skills that employers need.
- 54.6% – communication
- 46.6% – teamwork
- 38.4% – sales
- 36.4% – critical thinking
- 36.4% – adaptability
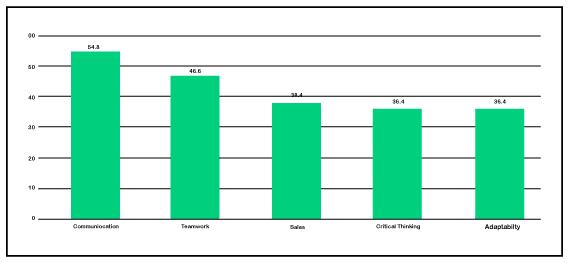
Communication and critical thinking took a significant portion of the skills the candidates lacked. Over a third of the candidates lacked these skills.
New Business Types
Not all small businesses start from scratch. Almost a third of them came from franchising.
The popularity of franchising means entrepreneurs no longer have to start a business from scratch. There’s been an increase in owners who bought an existing business, franchised one, or purchased an existing franchise.
Here are the relevant statistics.
- 10% of businesses bought existing franchises.
- 27.2% of businesses were new independent businesses.
- 31% of businesses were new franchises.
- 31.7% of businesses bought existing independent companies.
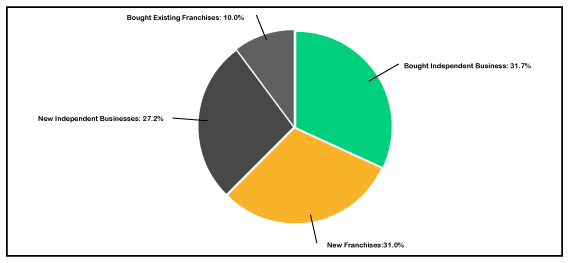
Only 27.2% of businesses were new independent businesses.
Small Business Growth Plans 2022
Businesses have to adapt to the post-pandemic era.
As per Guidant Financial, there was a surge of small business trends where businesses wanted to increase their staff in 2022.
Here are the most common small business plans:
- 13.2% said they want to invest in information services technology.
- 14.4% said they want to invest in business service technology.
- 23% said they want to invest in traditional marketing strategies.
- 39.7% said they want to invest in digital marketing.
- 41% said they want to expand or remodel their business.
- 51% said they want to increase staff.
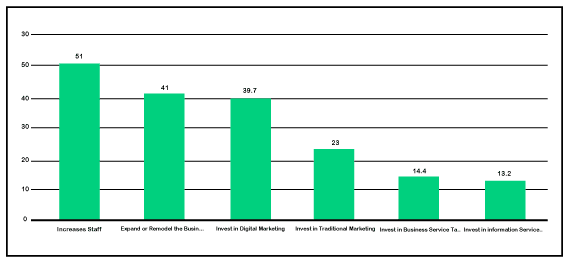
Despite COVID-19 hitting small businesses hard, it gave others room for new potential.
The small business landscape has evolved post-pandemic. Local companies have started seeing the value of digital marketing efforts and online presence.
The Importance of Social Media to US Small Businesses
A million small businesses and more are now looking at a business model incorporating social media marketing into their promotional strategies.
Although digital marketing strategies don’t revolve solely around social media, it still makes up a massive chunk.
77% of small businesses use social media to communicate with customers. According to KoMarketing, 86% of customers are likely to choose an alternative for lack of social media transparency.
Social media has become a cornerstone of business since it helps them compete, promote products, and improve customer service.
44% of small businesses said social media helped them grow, while 41% said they rely heavily on social media to drive sales and revenue.
SalesForce found 71% of growing small businesses could survive the pandemic due to digitalization.
The Influence of Ecommerce on Businesses
Ecommerce sales from online shopping experienced a massive 17.9% growth in the US.
27% of the global population turned to online shopping during the pandemic.
Millennial and Gen X customers played a considerable role in supporting small businesses. According to Mint Life, 45% of these age groups shopped online to support businesses.
56% of people who prefer to shop in-store are 45 years old and above.
20% of companies are working on building their ecommerce storefront.
According to PYMNTS, 42% of US small businesses in 2020 could adapt or expand through the help of digital technologies.
The Importance of Small Businesses
Some may overlook small companies, but they are vital to the economy.
A survey by SalesForce in 2019 found that 90% of the business population are small and medium-sized businesses or SMEs.
According to Zippia, 47% of Americans go to small businesses at least two to four times a week.
Here’s the breakdown for the different frequented small businesses:
- 77% of Americans regularly go to bakeries, restaurants, and bars.
- 40% of Americans regularly go to clothing, accessory, and shoe stores.
- 30% of Americans regularly go to gift, novelty, and souvenir stores.
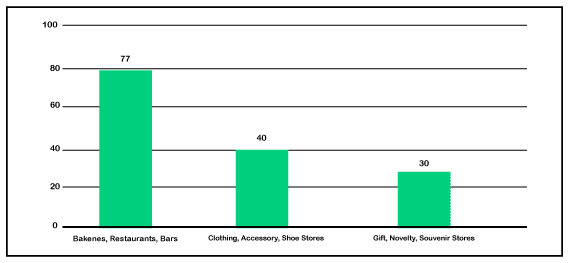
The most frequented small businesses are in the food and restaurant industry. It’s unsurprising why many entrepreneurs choose this industry.
On average, $0.67 of every $1 spent on small businesses goes straight to the community. $0.44 of every $1 goes directly to the small business owner and their employees.
The Bottom Line
I hope my article gave you insight into the value of small businesses to the economy and the community. Hopefully, I’ve also helped you decide whether or not starting a small business is ideal for you.
You must also know why a website is important if you’re planning a small business.

