Amazon business reports may sound intimidating, especially if you’re not a math or finance geek.
This guide, however, will help you break through the “maze of graphs and numbers” in those reports and know how to use valuable data in helping increase your sales.
There are plenty of other sellers on Amazon. Therefore, it’s hard to have your product immediately seen by customers when they search on the ecommerce site.
It’s also hard to know whether or not customers are interested in your stuff in the first place.
his is where Amazon seller business reports could prove very useful.
After you read this article, you’ll learn more about:
- The contents of the business report of Amazon
- Why they are important
- How to easily digest the detailed performance report and the large collection of data.
If you’re ready, let’s jump right in!
What Are Amazon Business Reports?

“A problem well stated is a problem half solved,” says pioneering educator John Dewey.
For Amazon sellers, tracking sales figures and other metrics is one vital way to learn about the problem of low or lackluster revenue and begin to solve it.
This is why business reports on Amazon are things you just can’t ignore.
According to ecommerce analytics provider DataHawk, Amazon Seller Central reports offer value by providing “all the information…and insights to help [sellers] track [their business’] weekly or monthly performance.”
DataHawk also mentions that these business reports empower sellers like you to “make strategic decisions to bring your business back on the right track.”
If you want to learn how Amazon business reports make all these possible, check out the next section of this guide.
Importance Of Using Business Reports
Sellers often use hunches or instincts to make business decisions. Are you one of them?
If you use instincts as your compass for business strategy, Forum has a different way of seeing things.
According to the digital marketing solutions provider, “data drives all good business decisions.” In other words, if you want your Amazon selling business to grow, you need to rely more on quality data instead of mere opinions.
This is where the business report of Amazon is so helpful.
Analytic Index explains well how Amazon Seller Central reports help sellers like you make the right data-driven decisions.
The e-commerce solutions provider says that business reports help merchants understand “what works, what doesn’t, and what they can improve on to grow.”
In other words, Amazon business reports are like the “squeaking sound of wheels” that helps you identify which aspects of your selling business needs some “oil” or proactive solutions.
You’ll learn later in the article how you can interpret business reports to solve online selling problems or improve your current profit margins.
Types Of Amazon Business Reports
There are three main types of business reports churned out by Amazon. Each report is classified according to how detailed the report is.
In one type of report, you will see “the forest” or a broad view of your sales figures and other stats. For the other types, you see “the trees” or more finely-tuned metrics.
So you can better understand what I mean, let me explain each type of business report and what information each contains.
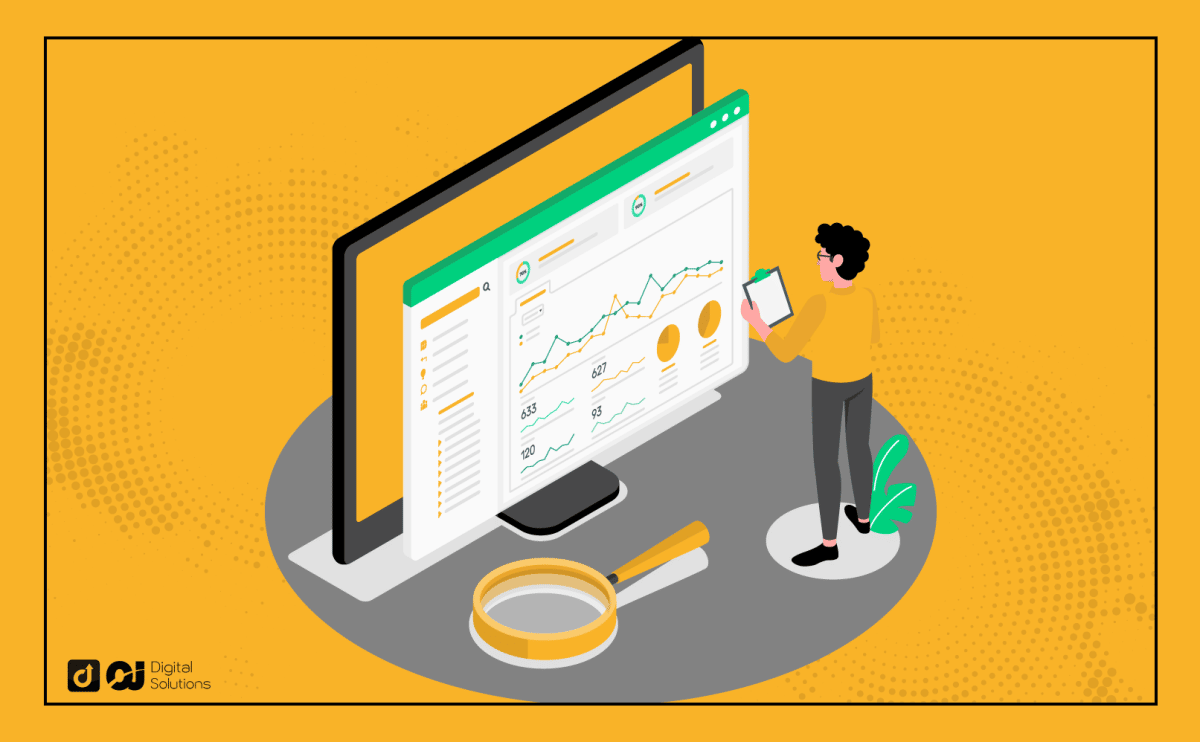
Sales Dashboard
Think of this as the bird’s eye view of your statistics, where you can hover over the forest of your total sales figure.
This dashboard provides an overview of your order and sales stats. You can also find graphs here where you can compare data like units sold, average order value, etc. from the previous day, week, or year.

Sales & Traffic
For the sake of illustration, this type of business report brings you to the specific area of the statistical forest you want to explore.
This report is more finely-tuned than the one on the Sales Dashboard, since Sales & Traffic provides data on a daily, weekly, or monthly basis. The time period covered depends on your choices, as you can see in the encircled part of the screenshot below.

Source: Jungle Scout YouTube Channel
Detail Page Sales And Traffic By ASIN
As you click the Detail Page Sales and Traffic report on the left-hand side of Amazon Seller Central, you move closer to more specific ‘trees’ of stats.
For example, you can get sales figures and page views for a particular product you’re selling (page views is the number of times customers looked at your product details page).
You can even get sales performance data based on each of your product’s Amazon Standard Identification Number or ASIN. If your product were a person, the ASIN is like the ID tag he or she is wearing.
I have discussed how much business reports could look like a forest of graphs and statistics. Luckily, you don’t have to get lost in the woods.
Read the next section and see how you can hack away the unnecessary stats so you can focus on the more important metrics for your business.
Metrics That Should Be Tracked

Do you dislike number-crunching and data analysis? Don’t worry, I can break down the business report part of Amazon in an easily digestible form.
Only a few numbers matter if you want to maintain or increase your profit margin on Amazon. I will show you what these numbers are and how you can use the data to help your business grow.
Units Ordered
WHAT THE NUMBERS MEAN: This figure means the total number of products your customers have purchased from you in total.
HOW YOU CAN BENEFIT FROM THE DATA: Since “units ordered” comes in numeric and graph form, you can track when or what time of year your products are in-demand and when they are not so hot in the market. You can use this to plan when to buy stuff for your inventory.
Total Sales
WHAT THE NUMBERS MEAN: There are two types of stats here: gross product sales and ordered product sales.
Gross product sales is equal to the number of units you sold multiplied by the selling prices of the products, plus any additional payments by customers like shipping costs.
Ordered product sales, on the other hand, does not take into account customers’ additional fees.
HOW YOU CAN BENEFIT FROM THE DATA: Tracking sales figures is vital because high sales figures tend to help improve your ranking on Amazon’s search results page (SERP), making your product more visible to more customers. Increasing sales and better SERP rankings positively feed on each other and lead to a virtuous cycle of growth.
Page Views
WHAT THE NUMBERS MEAN: The number of times customers view your product detail page/s. If the same user views two different product pages, it counts as two page views.
HOW YOU CAN BENEFIT FROM THE DATA:: Reduced page views could mean either poor SERP ranking or poor keyword phrasing in your product detail pages. Therefore, page views are good measures to check whether or not your product pages are optimized to haul in sales.
One way to improve your rankings on Amazon’s SERP to help your products’ earning potential is by hiring a copywriter to write keyword-optimized descriptions in your product pages.
To learn more about how to do this, you may read our article on the benefits of investing in an Amazon copywriter.
Sessions (Traffic)
WHAT THE NUMBERS MEAN: Imagine you have about 5 product pages (you’re selling 5 products on your Amazon store). Imagine those pages as shelves in one supermarket. If one customer browses one or more of your product pages within a 24-hour period during a visit, it counts as one session.
Think of one Amazon session as the “real-world” equivalent of one trip to a supermarket by a specific person.
Two sessions, on the other hand, could mean either of the two cases below:
- Two visits by the same person, where the visits are at least 24 hours apart.
- One visit by two different people, regardless of the “24-hour window.”
HOW YOU CAN BENEFIT FROM THE DATA: Many ecommerce experts indicate that having less than 100 sessions per month for a product or product page is cause for concern. This could mean customers are not that interested in your product/s, which could lead to lower conversion rates.
Discover how conversion rates are related to sales figures by reading our guide on the Amazon Conversion Rate statistic.
Another way to enhance conversion rates is to add unique content on your product page/s. Learn more about this type of content and how you can use it to your advantage by reading our article on Amazon A+ content.
Buy Box Percentage
WHAT THE NUMBERS MEAN: If you’re a high performing Amazon seller, you could get a “Buy Box” privilege. If Amazon awards you the “Buy Box,” the platform puts a link to your product page, complete with “Add to Cart” and “Buy Now” button, on the product page of another seller. Check out the image below to get a clearer picture of what I mean.

Buy Box percentage is basically the number of times your “Buy Box” appears in the product page of another seller.
For example, if a product page of another seller is viewed 100 times for an hour, and your product shows up 80 times in the Buy Box for that competitor page, your Buy Box percentage is 80%.
HOW YOU CAN BENEFIT FROM THE DATA: If you have a very low Buy Box percentage, it could mean many things. For one, your customer service or product quality may be poor or you may have accumulated a lot of negative customer reviews.
Therefore, a low percentage (which which is below or equal to 10%) can become an opportunity to enhance the quality of your business operations.
To encourage product reviews that are positive and coming up with a pricing strategy that is reasonable yet cost-effective are other ways to improve your Buy Box percentage.
Unit Sessions Percentage (Conversion Rate)
WHAT THE NUMBERS MEAN: Amazon calculates this percentage by dividing the number of units ordered or bought by the number of sessions, as the equation below indicates:

HOW YOU CAN BENEFIT FROM THE DATA: Some experts say that a percentage of around 12% or higher (12 percent is around 12 units of products sold per 100 visits to a product page) is ideal.
Anything below 12% could mean problems with conversion rate (conversion to sales) or less product page visits.
Now that I have covered all the vital stats you should focus on while reading business reports, it’s time to check out a mini-dictionary of terms that could help you better understand Amazon Seller Central business reports.
Amazon Business Report Terms

Here are some important terms that you may encounter when dealing with Amazon business reports.
- Average Sales Per Order Item – Derived by dividing the ordered product sales by the total number of units sold for a selected time period.
- Average Selling Price – Calculated by dividing the ordered product sales by the total number of units sold for a set time period.
- Gross Product Sales – The number of items sold for a time period is multiplied by the total amount which customers paid for, including extra fees like those for shipping, gift-wrapping, etc.
- Ordered Product Sales – The same multiplication operation to derive gross product sales is done, but without including extra fees like shipping costs, etc..
- Page View – The number of times customers visit your product page.
- Session – A session is equal to one visit by a particular customer within a 24-hour period. In counting the sessions of more than one customer, the per-head system is used without regard for the one-day window.
Now that you have comprehensive knowledge about Amazon business reports, some of you may still have questions in mind. Fortunately, there is still the FAQ section to come.
FAQs – Frequently Asked Questions
How Do I Download A B2B Report From Amazon?
The Swiss non-profit trade organization ICSTD mentions the following steps in pulling a Sales Report from Amazon:
- Go to the download center at the bottom of the Business Reports page of Amazon Seller Central.
- Select the type of report that you prefer to download.
- Set the time period covered in your Amazon business report.
What Is Reporting On Amazon?
Reporting on Amazon can be roughly divided into two types: Business and Advertising Reports.
While Business Reports enable sellers to come up with a broad range of growth-enhancing business strategies, Ads Reports are mainly focused on advertising strategy or how sellers market their products.
Do All Amazon Sellers Get Full Access to All Business Reports features?
In general, Fulfillment by Amazon (FBA) and Fulfillment by Merchant (FBM) sellers have different levels of access to business reports.
An FBA seller who is subscribed to the Professional Selling Plan has the most complete reports data. However, that seller has to pay extra fees.
On the other hand, FBA sellers who opt for the Individual Seller plan and FBM sellers have limited access to Amazon business reports.
What Are The Sessions In Amazon Business Reports?
A session in Amazon Business Reports is one visit made by a customer towards a product page.
If that customer visits the same product page twice within a 24-hour period, it counts as one session.
If he or she visits twice, where one visit is more than 24 hours away from the other visit, it’s counted as two sessions.
Two visits by two different customers, on the same product page, are counted as two sessions.
In summary, the 24-hour period is the basis for counting the sessions of a particular customer while head count is used in counting the sessions of different customers.
A Few Last Words
Amazon Business Reports can be tricky if you don’t know where to look.
You’ve now learned which parts of the report you need to focus on and what valuable insights can help you improve your online business.
It’s time to put these ideas into action and see for yourself how they can help improve your sales figures.
Was this guide helpful? What other Amazon-related topics would you like me to cover next?
Please feel free to leave your ideas in the comments section below.