6 Best Amazon Analytics Tools To Improve Your Amazon Selling Experience in 2023
-
By Omar Deryan
- Updated on
Investing in the best Amazon analytics software is essential to becoming a successful seller. Around 2 million small and midsize third-party companies were selling on Amazon in 2020 alone.
To rise above the competition, you need to optimize your Amazon product strategies, know what your customers want and need, and boost customer satisfaction. That’s why I researched and ranked the best Amazon analytics tools.
Here’s the overview at a glance:

Seller Board offers tools to better analyze and improve your profit on Amazon.

Hands down, the best keyword research, tracker, and listing optimizer in the market.
MBS gathers information from your Seller Central account to create tables and graphs.

HelloProfit is a software allowing you to monitor your sales stats, rankings, and profits.

ZonGuru Business Dashboard presents data your Amazon business needs to scale up fast.
Table of Contents
The best Amazon analytics software allows you to make adjustments to your current Amazon selling strategies. They also allow you to monitor your competitors’ performance so you can determine what makes them successful and adapt your strategies.
Let’s get to the list.
Omar's Take
Seller board has a user-friendly platform that allows you to access the data you need to make better business decisions, improving your cost-effectiveness.
To make these tasks easier, seller board provides a platform where you can analyze and monitor all the data you need. sellerboard’s team of experts can even give you advice to improve your profits.
-
Best For Overall
-
Price Starting at $15/mo
-
Annual Discount Yes
-
Promotion 2 Months Free Trial
Key Features
As the best profit analysis software, sellerboard contains the essential tools that allow you to analyze your cost-effectiveness and profit on Amazon. This includes PPC Optimization, Listing Change Alerts, Inventory Management, and a Profit and Loss Table.
PPC Optimization
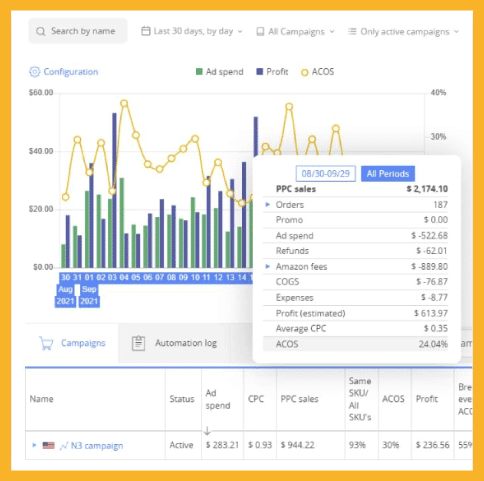
sellerboard’s PPC dashboard gives you an insight into the profitability of your ad groups, keywords, and PPC campaigns. The dashboard also assists you in optimizing bids so you can attain your ideal profitability.
To make better recommendations, the team behind sellerboard created an algorithm that estimates profit by PPC campaign. After generating the estimate, sellerboard calculates the breakeven-bid and the breakeven-ACOS for every keyword.
Listing Change Alerts
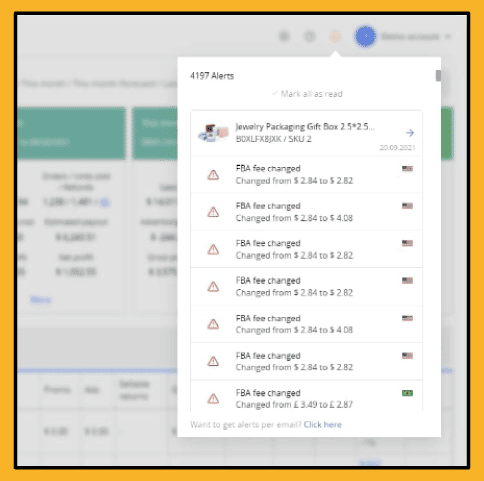
sellerboard monitors both your seller and listings feedback. If any important events require your immediate attention, sellerboard will send you an email notification. Here are some examples of important events:
- New sellers of the listing
- Loss of the Buy Box
- Listing changes, including name, main image, description, and product category
- Changes in FBA and referral fees
- Neutral or negative seller feedback
Inventory Management
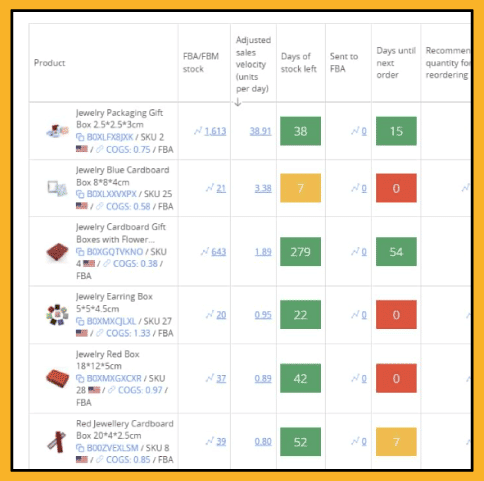
sellerboard’s Inventory health analytics informs you that you need to get in touch with your supplier if any of your products are low. In addition to this, sellerboard even provides a recommendation on how many products you should buy from a supplier.
By calculating the adjusted sales speed of every product (which is based on configurable seasonality parameters, past sales, and projected growth), sellerboard will send you a notification that you need to send more products to Amazon’s FBA warehouse, ensuring you won’t run out of stock.
Profit and Loss (P&L) Table
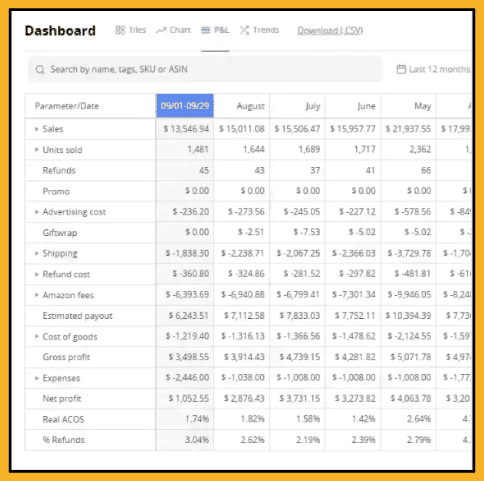
sellerboard’s clickable P&L statement focuses on parameters relating to your profitability.
You can also customize the time frame and granularity of the data on the P&L table, giving you information about how popular your products are during a specific season.
Pricing Plans
sellerboard only works for Amazon sellers in Germany, the USA, the United Kingdom, France, Canada, Spain, Mexico, and Italy.
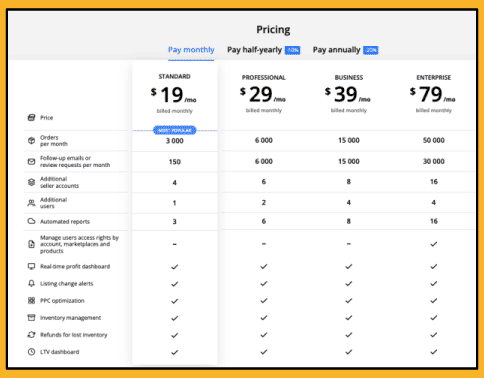
If you’re in any of these countries, here are sellerboard’s pricing plans:
- Standard: $15/mo
- Professional: $23/mo
- Business: $31/mo
- Enterprise: $63/mo
You also have the option to pay half-yearly or annually, allowing you to save 10% or 20% of the monthly price, respectively.
Pros and Cons of Sellerboard
Here’s what I like and dislike about sellerboard.
Pros
- The tool provides recommendations based on actual seller data
- Has a free trial or demo account offer
- Detects areas to improve seller’s profit, such as rank position on SERPs, product ranking, conversion rates, and more
Cons
- Complicated for new Amazon sellers
- Doesn’t have a money-back guarantee
If you want to track how your listings are doing and want to ensure they don’t run out of stock, sign up for a demo Sellerboard account.
Omar's Take
Helium 10 lets Amazon sellers easily manage products, identify trends, keyword tracking software, streamline ad campaigns, and optimize their listings.
In addition to being a popular research software, Helium 10 also provides the necessary tools Amazon sellers need. amazon seller analytics tools will provide data that boost your products chances of success after launching them on Amazon.
-
Best For Tracking Profits
-
Price Starting at $39/mo
-
Annual Discount Yes
-
Promotion Special Discount
Key Features
Helium 10 offers three tools: Profits, Market, and Keyword Tracker.
Profits
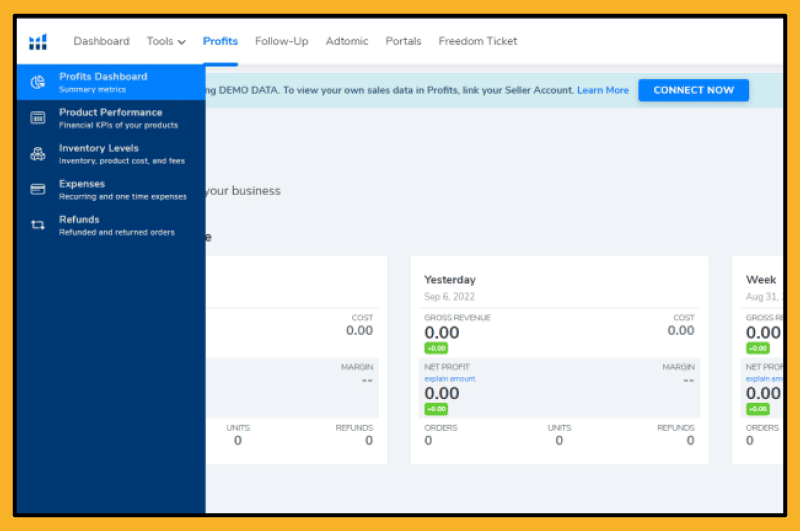
Profits provides various data points that can impact your business’s overall profitability. This analytic tool will display data that lets you gauge your product listings’ financial status.
With this Amazon product analytics tool, you can identify which of your products are increasing or decreasing in revenue. This information allows you to decide if you should continue or stop offering a particular type of product.
Profits also allows you to see your gross revenue and net profit after estimated costs for specific time periods.
Market Tracker
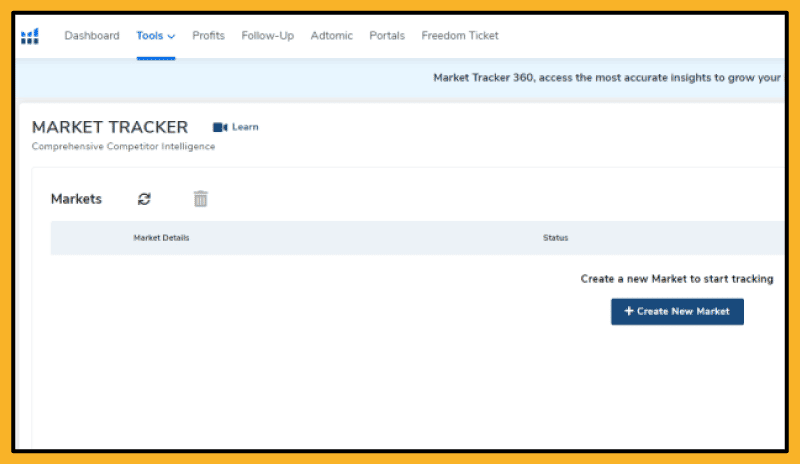
Market Tracker displays the analytics, rankings, and insights of the market you’re selling in. This means you can:
- Identify the market health
- Know where your listings currently stand
- See how your competitors are performing
By having a bird’s eye view of the market, you can apply the appropriate strategy to get ahead of your competition. With Helium 10’s algorithms, Market Tracker can give relevant product suggestions so you can create your market accurately.
Keyword Tracker
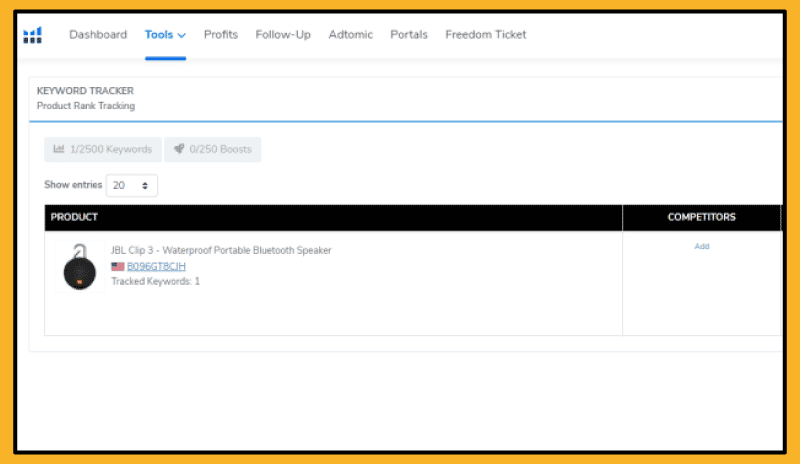
Helium 10’s Keyword Tracker allows you to track sponsored positions and organic keywords in real time. Keyword tracking lets you monitor your ranking keywords in a user-friendly dashboard.
Pricing Plans
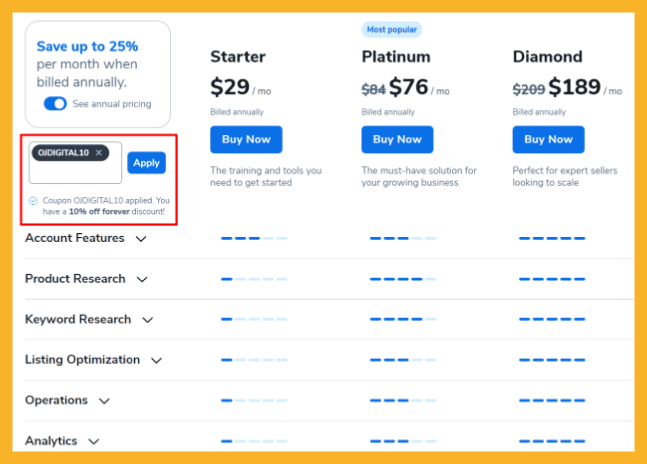
In addition to having generous discount coupons, Helium 10 has five pricing plans you can choose from:
- Starter: $29/month
- Platinum: $84/month
- Diamond: $209/month
- Elite: $399/month
- Custom
All of these subscription plans come with a one-month money-back guarantee. You’ll receive two months free if you pay annually for any type of subscription. Helium 10 also offers discount coupons.
Pros and Cons of Helium 10
Here’s what I like and dislike about Helium 10, but don’t miss my in-depth review of the tool.
Pros
- User-friendly interface
- No need to switch between different platforms when optimizing your listing
- Good value for 20+ tools
- Offers a free version for first-time users
- Powerful Amazon data analytics tool
- Paid subscription gives you instant access to Amazon Freedom Ticket, a valuable Amazon training resource.
- One of the best Amazon analytics software available today
Cons
- Free plan has limited features
- Can be expensive for new Amazon sellers
- Steep learning curve
Alternative
If you want to know how Helium 10 stands against other Amazon sales analytics tools, check out my comparison of Sellics vs. Helium 10.
Omar's Take
ManageByStats is a third-party tool that connects to Amazon Seller Central, transforming important pieces of information into easy-to-read tables and graphs. It takes Amazon selling to another level by providing high-quality data.
This Amazon brand analytics tool gives insight into your market and helps you communicate with existing and potential customers. ManageByStats’ key features allow SMEs (small and medium enterprises) to expand confidently.
-
Best For Medium-Level Enterprises
-
Price Starting at $15.00/mo
-
Annual Discount 30% OFF
-
Promotion Free Trial
ManageByStats is a third-party tool that connects to Amazon Seller Central, transforming important pieces of information into easy-to-read tables and graphs. It takes Amazon selling to another level by providing high-quality data.
This Amazon brand analytics tool gives insight into your market and helps you communicate with existing and potential customers. ManageByStats’ key features allow SMEs (small and medium enterprises) to expand confidently.
Key Features
ManageByStats provides a core suite of tools for Amazon sellers to analyze essential data that will improve their sales. These tools help you make adjustments so you can reverse unfavorable results.
Statistical Analysis
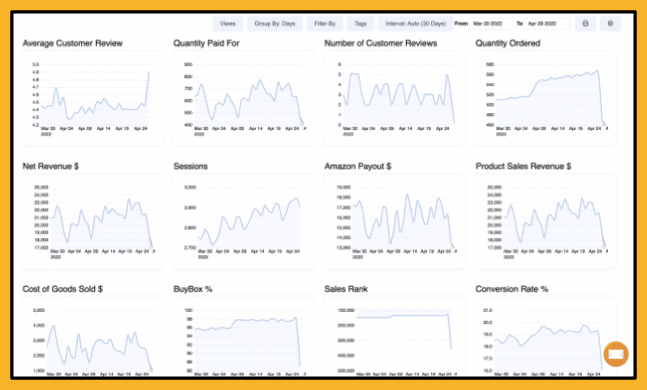
ManageByStats’s main feature is its rich statistical analytics.
With flexible, detailed graphs, you’ll have a complete view of your products’ statistics on a single page. Here’s what the sales graph analyzes:
- The number of units you ordered
- Your Buy Box percentage
- Revenue after discounts
- The exact amount of your Amazon payouts
Main Dashboard
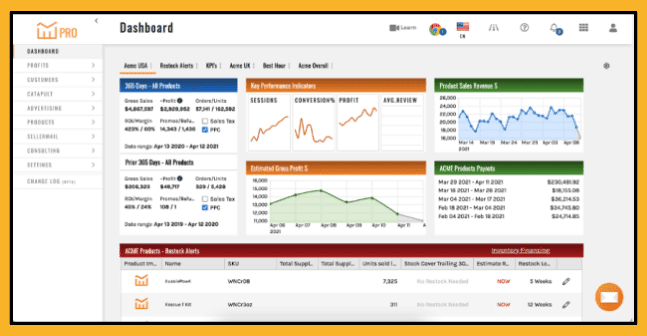
The dashboard of this Amazon analytics tool has plenty of visual benchmarks displaying in real time the health of your business in real-time. You can also create dashboards for individual products or groups.
ManageByStats dashboard displays your product KPIs (Key Performance Indicators), including:
- Sessions
- Estimated Profit
- Review Average
- Conversions
Advertising
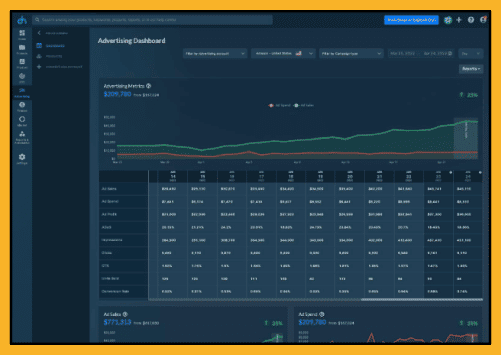
ManageByStats’s advertising hub helps you analyze every component of your ad spend. You can access information about the costs associated with your PPC campaigns.
Having the right information for your campaigns will provide you with helpful advice on how to drive more traffic to your listings. As a result, you can increase your sales.
Pricing Plans
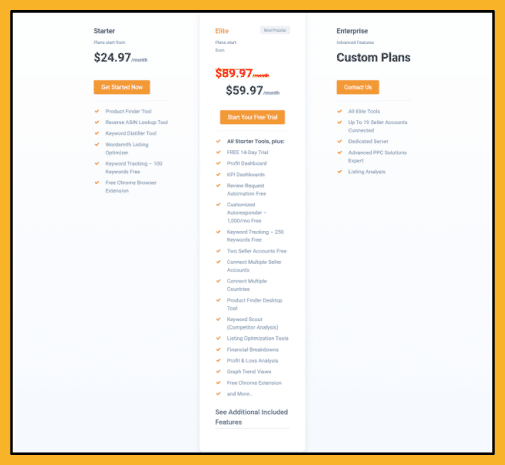
ManageByStats provides users with a two-week free trial. If you decide to use ManageByStats as your Amazon sales analytics tool, you can choose either the Starter Plan ($24.97/month) or the Elite Plan ($89.97/month).
ManageByStats offers a custom plan with more features and a dedicated server.
Pros and Cons of ManageByStats
Here’s what I like and dislike about ManageByStats.
Pros
- Fully customizable dashboards
- Less wasted cost in your ad campaigns
- Easy product research
Cons
- May not be ideal for beginners
- Content overload
- Limited only to Amazon
ManageByStats allows you to take charge of the statistics you need to run your Amazon business. If you fully optimize this Amazon brand analytics tool, you can adjust your selling strategies and make the right decisions to promote more sales.
Omar's Take
HelloProfit’s comprehensive software gives sellers complete financial control of their online business by giving accurate sales, ranking, and profit data.
If you’re looking for an Amazon sales analytics tool that’s considered the best seller rank tracker available, HelloProfit is a solid choice
-
Best For Tracking Spending
-
Price $97.00/mo
-
Annual Discount No
-
Promotion Free Trial
HelloProfit’s comprehensive software gives sellers complete financial control of their online business by giving accurate sales, ranking, and profit data. If you’re looking for an Amazon sales analytics tool that’s considered the best seller rank tracker available, HelloProfit is a solid choice.
HelloProfit is the best seller rank tracker for the following reasons:
- Well-designed dashboard
- Profits, gross sales, and ROI (Return on Investment) data on all product variations
- Detailed reporting features for fees, payouts, promos, and sales
Key Features
Merchant Dashboard
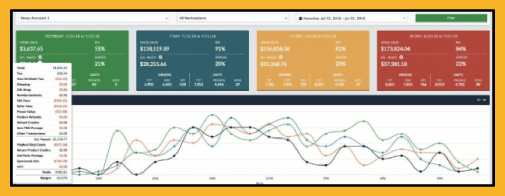
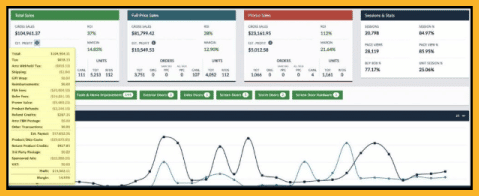
HelloProfits’s dashboard shows all your metrics and data in a single display. Even if you have multiple seller accounts, the dashboard can provide the total metrics for everything.
Here are some of the key metrics in the dashboard:
- FBA fees
- Shipping
- Gift wrapping
- Referral fees
- Tax
- Total VAT bill
- Revenue
- Sponsored Ads
- Profits
Product Dashboard
This section shows important statistics about every product you sell on Amazon. Since the products are in a single platform, you can quickly see products that are doing well and those that aren’t.
To make things more convenient for you, the product dashboard also allows you to hide irrelevant data.
Payout Reporting
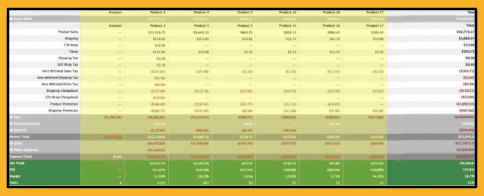
HelloProfit’s payout reporting section gives you a complete and itemized breakdown of your finances.
This means you can go through everything — SKU by SKU and ASIN by ASIN — in a single display. Both income and expenses are displayed together, too.
Pricing Plans
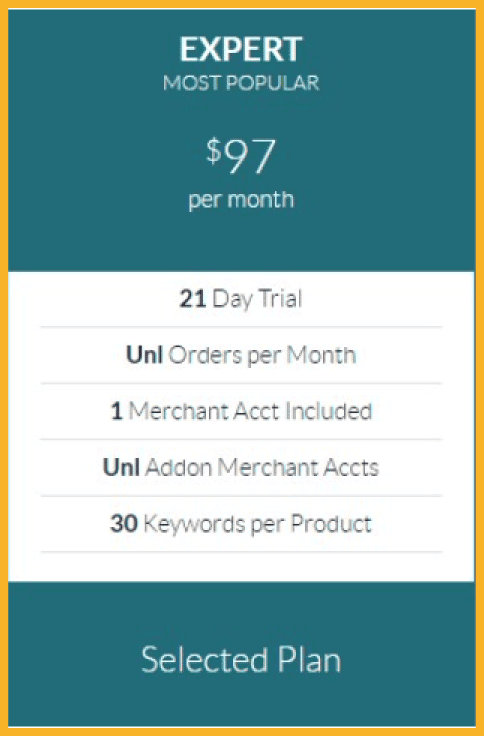
HelloProfit provides first-time users a 21-day free trial. After the free trial, you can subscribe to the Expert Plan, which costs $97/month.
Pros and Cons of HelloProfit
Here’s what I like and dislike about HelloProfit.
Pros
- Excellent brand analytics tools at an affordable price
- Great PPC manager
- Well-designed and intuitive
Cons
- Some of the smaller tools have better alternatives
- Pretty lacking in tutorial and editorial content
- Despite having a simple design, new Amazon sellers may still find it confusing
If you want to easily track your Amazon seller account’s finances in one place, you should try it out.
Omar's Take
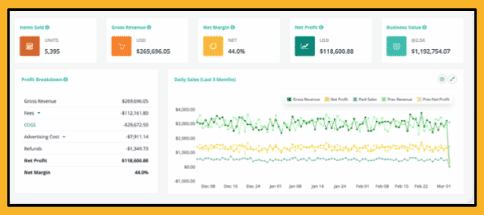
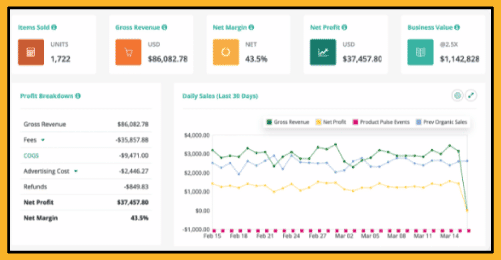
ZonGuru’s Business Dashboard shows how profitable you are, how much you spend on ads, the best and worst SKUs, and more.
The Business Dashboard is one of 17 ZonGuru tools that help you analyze data and track your brand or product performance.
-
Best For Reliable Customer Support
-
Price Starts at $29.00/mo
-
Annual Discount Yes
-
Promotion Free Trial
ZonGuru’s Business Dashboard shows how profitable you are, how much you spend on ads, the best and worst SKUs, and more. The Business Dashboard is one of 17 ZonGuru tools that help you analyze data and track your brand or product performance.
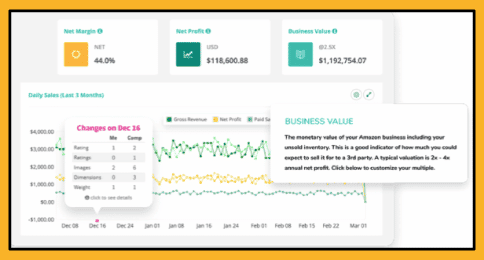
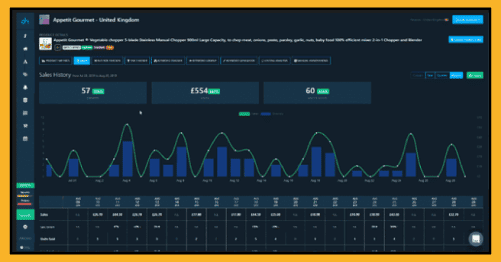
ZonGuru’s Business Dashboard displays your brand’s overall worth, sales history, and any changes to this information. The Business Dashboard also shows other important data that can improve your product, such as customer reviews and the net margin of a particular product.
Key Features
Essential Metrics
ZonGuru’s dashboard contains all the data you need to make an informed decision. Here are some essential metrics highlighted on the Business Dashboard:
- Advertising Cost: Shows how much you spend on Sponsored and Product ads
- Inventory: Displays when you should restock
- Revenue and Potential: Gives you an easy way to balance your budget
- Reviews: Shows what customers think about your brand or products
Product Pulse Events
The Product Pulse Events is a section of the Business Dashboard that marks every change you make to your listings. If your business operations aren’t going smoothly, you can start finding other strategies immediately.
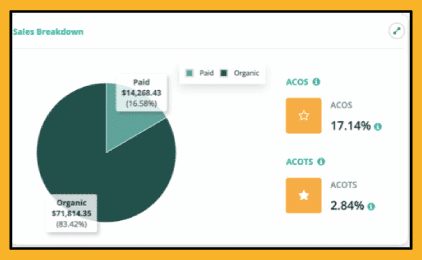
Sales Breakdown
This section gives you the numbers of every product you sell. You can also choose a specific product so you can optimize it.
Business Valuation Widget
With this widget, you’ll have an idea of how well your brand is doing. Since the widget can show a specific trading period, you can conveniently recall the strategies you’ve used in the past, allowing you to reapply them in the future.
Pricing Plans
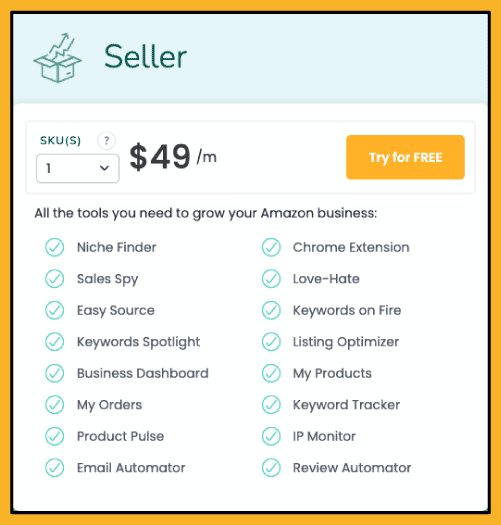
ZonGuru’s Business Dashboard is only available with their Seller Plan, which costs $49/month. If you want to pay per year, the Seller Plan will cost $456, which saves you $11/month.
Pros and Cons of ZonGuru Business Dashboard
Here’s what I like and dislike about ZonGuru.
Pros
- Offers a free demo
- Other than the Business Dashboard, ZonGuru has other essential features for a successful FBA business
- Amazing customer support
- Its recent Chrome extension and mobile application updates offer users great convenience
Cons
- The Seller Plan, which is where the Business Dashboard tool is included, may not be suitable for new Amazon sellers
- The Seller Plan is relatively expensive
- Short free trial
Read my ZonGuru review for a more detailed look at the tool.
Start a Free Trial of ZonGuru’s Seller Plan
If you want ZonGuru’s Business Dashboard, remember that it’s only available in the Seller Plan. Nevertheless, the Seller Plan contains all of ZonGuru’s user-friendly tools, which makes the price a worthy investment.
Omar's Take
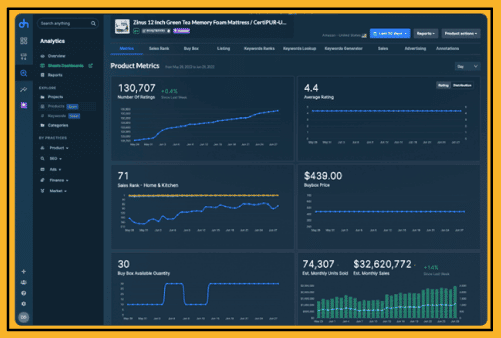
DataHawk is an ecommerce Analytics and Optimization platform that help you optimize your profit margins, increase sales, and boost productivity. It tracks your SEO, product, ads, market, and finance data so you’ll have the data to improve your marketing strategy and product listings.
As a state-of-the-art SaaS analytics tool, DataHawk is one of the go-to analytics software used by millions of Amazon sellers and other popular online marketplaces, like Walmart and eBay.
-
Best For User Experience (Interface)
-
Price Custom
-
Annual Discount N/A
-
Promotion N/A
Key Features
SEO Analytics
This feature helps you increase your conversion rates and grow your organic traffic on Amazon.
All of the tools in DataHawk’s SEO analytics give helpful insights on optimizing your listings and the contents of your product details page.
- Keyword Research Tool
- Keyword Rank Tracker
- Listing Optimization Tool
Product and Competitor Analytics
By monitoring and receiving alerts on all of your products’ performance, DataHawk’s Product and Competitor analytics allow you to immediately and effectively respond to any changes regarding keyword ranks, price, best seller ranks, reviews, star ratings, Buy Box, and listings data.
Advertising Analytics
Advertising Analytics assists you in enhancing your Sponsored Ads’ performance.
By giving you the KPIs on ASIN levels and delivering custom reports on your ad metrics, you gain insights into how each of your ads affects your selling performance.
Sales Analytics for Amazon Seller Central
DataHawk’s Finance feature can help improve your business strategy in the following ways:
- Measuring financial health
- Analyzing financial reports
- Assessing recent product sales data
Pricing Plans
DataHawk’s pricing plans come with a 14-day trial, which gives you ample time to learn every analytics tool.
After your free trial, you can decide on which of these plans suit your business needs the most, all of which are relatively affordable:
- Feather: $44/mo
- Claw: $177/mo
- Hawk: $375/mo
- Custom pricing available
Pros and Cons of DataHawk
Here’s what I like and dislike about DataHawk:
Pros
- Powerful analytics tools to improve your Amazon SEO
- Products estimated sales
- Automated scheduled reports
- Insightful Amazon competitive data
Cons
- Lack of advanced features
- Relatively new compared to Helium 10
Start Your Free Trial
If you’re looking for a flexible pricing plan and extremely user-friendly interface, start your free DataHawk trial.
FAQs
What to look for in an Amazon brand analytics tool?
The best amazon analytics software should give you access to the following key metrics:
- Product ranking
- Seller rating
- Sales revenue
- Conversion and order defect rate
- Inventory and fulfillment performance
- Profit margin
- Customer retention
What’s next once you have an Amazon marketplace analytics tool?
Having Amazon research software doesn’t immediately guarantee success. In fact, you still need to invest in a repricer and an FBA error analytics tool to have huge Amazon profits.
So, once you’ve chosen an Amazon analytics tool, find other software to help your Amazon selling journey. I advise checking my guide about the best Amazon seller tools.
Bottom Line
The best Amazon analytics tools for Amazon will depend on your needs and preferences. If you want the best Amazon analytics software, opt for Helium 10. On the other hand, ManageByStats is a smart choice if you’re just starting.
Whatever you choose, your selling strategy shouldn’t be fully dependent on them. Your tools should only be a conduit — your products and your dedication as a seller will still be the driving force behind your success.
Omar Deryan
Founder of OJ Digital Solutions

